Today’s modern business jets have a high standard of quality and the NVH (Noise, Vibration, and Harshness) experienced during the flight should be kept to a comfortable minimum. Undesired noise inside the cabin has to be avoided or eliminated. Before noise reducing measures like insulation can be applied however, the noise sources have to be identified and localized… a difficult task when using standard acoustic measuring techniques, as they do not provide any information about the location of the sound source.
To actually locate the undesired sound sources a more specialized tool has to be used - the Acoustic Camera (Fig. 1) – which literally enables the user to “listen with his eyes”. But how does this work?
Measurement principle
The Acoustic Camera consists of an optical camera, an array of microphones and a data acquisition system required to process the big amount of data. While the optical camera takes a picture of the desired measuring object, the microphones record the sound of the object. Using a technique called beamforming any sound sources are then visualized and color coded on the optical image. Taking the whole principle one step further the same can be applied to a 3D model instead of a 2D optical picture. In this case the optical picture is used to correctly align the 3D model during postprocessing for the 3D beamforming algorithms.
The beamforming technique exploits the fact, that the speed of sound as well as the relative positions of the microphones and every point of the 3D model are known. Using this information, the beamforming algorithms apply the runtime delays between the different microphones of the array to each point of the 3D model. By summing up all channels for each calculation point and each time or frequency the algorithm is able to differentiate between areas with sound sources and areas without sound (Fig. 2):
Fig. 2: Analyzing a measurement plane with beamforming
This way different noise types (broadband, narrow-band, stationary or impulse noises) can be analyzed and located accurately, even in low frequency ranges and in loud environments.
Measurement setup
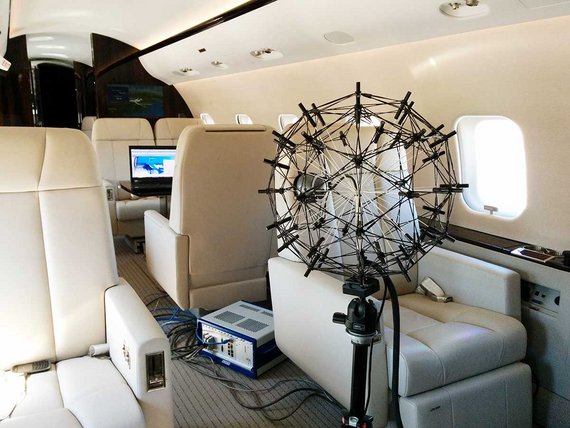
The measurement setup inside the aircraft cabin consisted of a spherical microphone array with 48 microphones (Sphere48) mounted on a tripod and a data recorder (Fig. 3). To operate the system a powerful laptop computer with the NoiseImage 4 software suite was used. To cover the whole aircraft cabin 3 measurement positions were identified in the front, middle and back. For each measurement position multiple acoustic measurements of 10 to 30 seconds were performed while the aircraft was in flight. Additionally, a 3D model of the cabin was generated using a 3D scanner.
Postprocessing
As a first step the 3D model was imported in NoiseImage using the Acoustic Photo 3D module. Based on the optical picture of the camera integrated in the Sphere48 array the 3D model was then aligned correctly to fit the orientation of the array. To identify the sound sources of interest the acquired measurement data was not only analyzed in the time domain but also in the frequency domain using the Spectral Photo module. Clearly distinguishing and localizing the sound sources over the high background noise of the flying aircraft required a higher dynamic range than the microphone array alone could provide. Therefore, the Advanced Algorithms module of NoiseImage was used to maximize the dynamic range.
Results
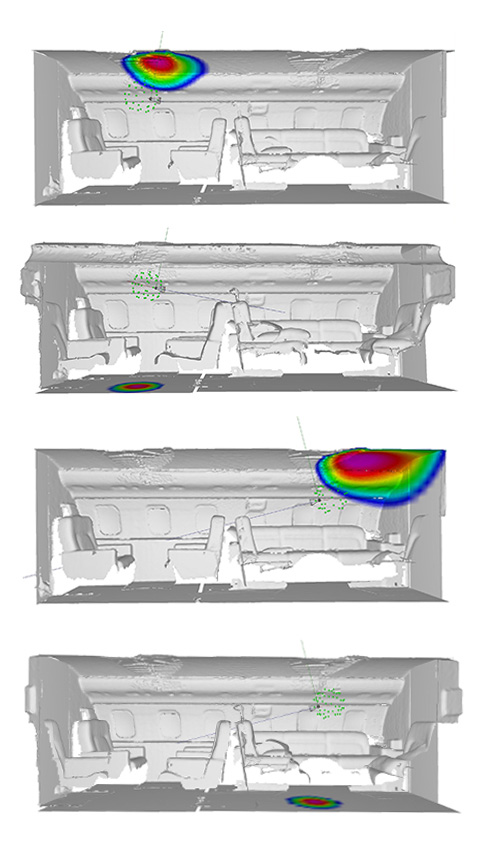
The sound pressure levels (SPL) showed a significant increase of 2 dB in the front and the middle sections of the cabin. After applying an A-weighting filter, the difference did not seem to be as significant (less than 1 dBA). The major emissions could be located in the middle of the passenger cabin, above 630 Hz. In the time domain the loudest sound sources were located at the ceiling above the chosen measurement position, 85.22 dB (front) and 83.06 (back) dB.
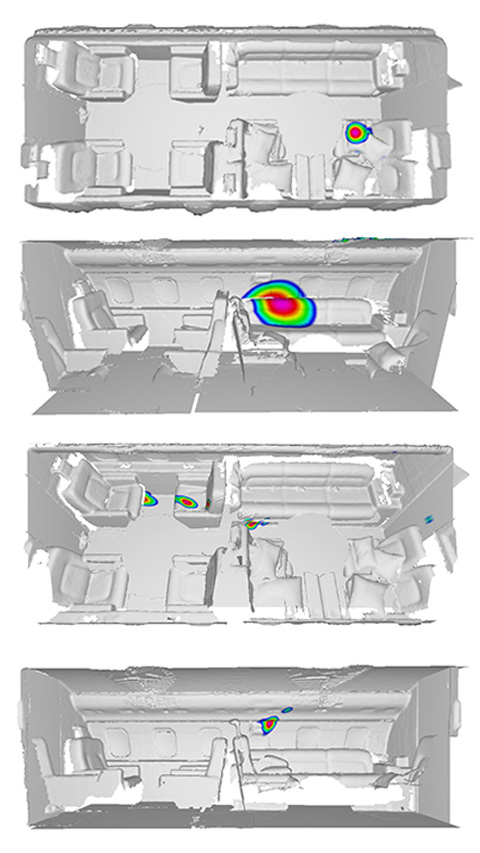
In both scenarios, ground-reflected sources, around 68 dB, can also be seen (Fig. 4). In the frequency domain the origin of the noise was found in different third octave bands of 250 Hz, 315 Hz, 3150 Hz and 6300 Hz. The sound was radiating from the floor in the middle of the cabin and from the side of the fuselage (see Fig. 5).
After identifying the dominant sound sources the interior design of the aircraft cabin was changed to minimize NVH and maximize passenger comfort.
Outlook
Using a spherical array and applying the beamforming technique to the 3D model of an interior room is valid method to determine the location and quality of sound sources in that room. It is not only used inside aircraft cabins (as in the given example) but also in trains, cars and building interiors to gather data for efficient and effective sound design optimization.
Images courtnesy: Images courtesy of the authors unless otherwise specified.