
Diseases of the heart and circulation are the most common cause of death - even before cancer! So we should pay a lot of attention to the health of the heart. But how? Everyone knows the rise of pulse when the doctor measures the heart function, for example, with the electrocardiogram (ECG). It would be better to check the heart function unnoticed, e.g. when brushing your teeth in the morning. If everything is fine, then nothing happens. But if something is wrong, the cardiac outpatient clinic receives a notifier, depending on the abnormalities detected.
In the case of patients with burns in the chest area, premature infants with extremely sensitive skin or accident victims trapped in a vehicle, for example, the application of electrodes as in the measurement with the electrocardiogram (ECG) is no available option. So there is a need for another - non-contact - measurement of the cardiac function.
But how to measure the cardiac function remotely without contact? The answer is a laser Doppler vibrometer (LDV), like a Polytec single-point vibrometer using a wavelength of λ = 1550 nm, which measures non-contact and eye safe. The LDV does not measure the electrical activity of the heart itself, but the mechanical movement caused by the heart on the body surface. This will be difficult when wearing clothes, but it can work even through thin textiles such as pyjamas in the chest area or even on the neck, which would normally not be covered.
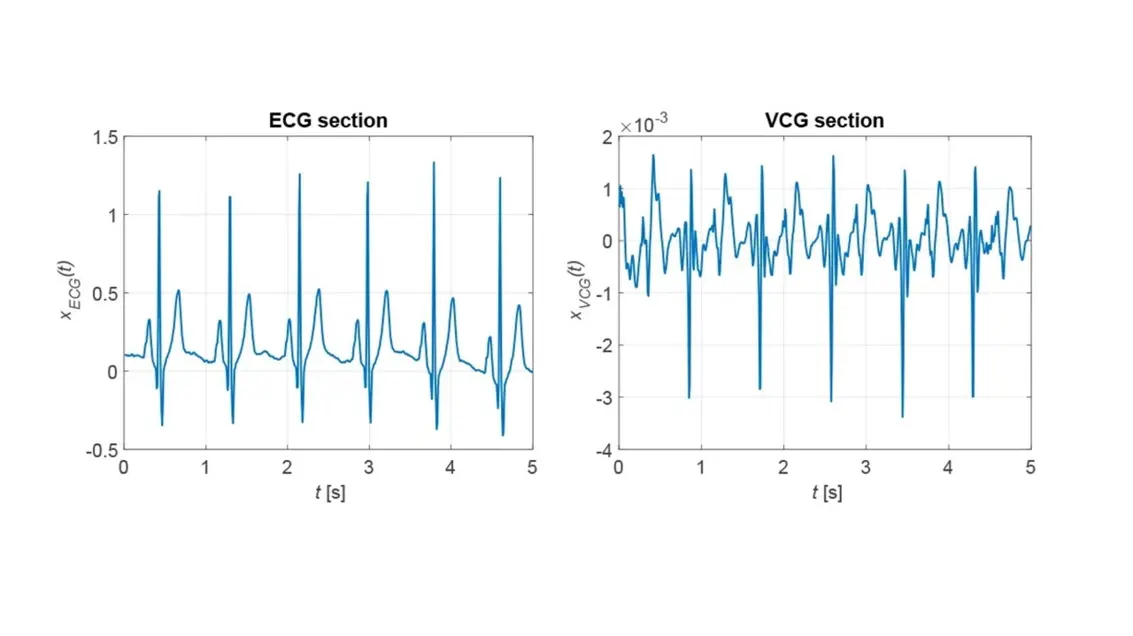
Anyone expecting the ECG measurement curve to match the curve obtained by the vibrometer, here referred to as a vibrocardiogram (VCG), will be disappointed. This is shown by the two measurement results in Figure 1. The ECG shows the usual course. Clearly visible are the upper and lower peaks of the ECG, labeled P, Q, R, S and T, which one looks for in vain in the VCG. But the spacings of the extreme peaks are identical in both measurement methods. This means, the instantaneous heart rates - here about 1.2 Hz or 72 beats per minute (bpm) – do match in both measurement data, so anomalies can indeed be detected.
A look behind the scenes of the vibrometer signal
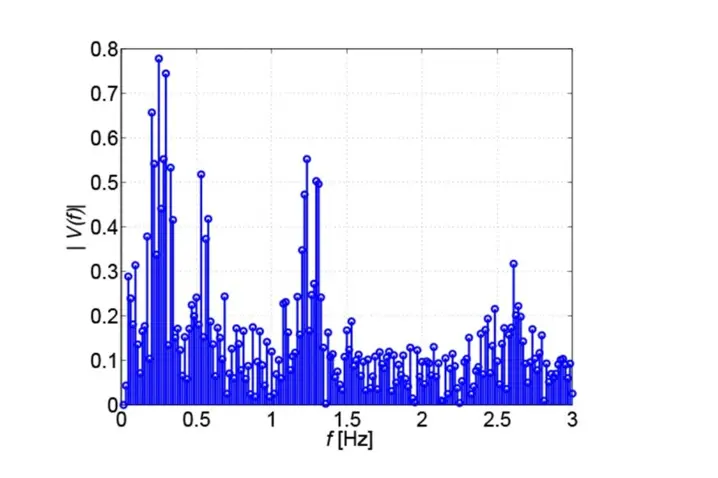
The ECG is an electrical signal, so it only records the activity of the heart. In contrast, the VCG shows the mechanical movement of the heart muscle. This can be seen in the spectrum of the VCG in Fig. 2, showing three cluster points of spectral lines: at f = 0.25 Hz, f = 1.2 Hz and f = 2.4 Hz. The middle spectral cluster corresponds to the heart rate. Since the heartbeat varies slightly with time and the measurement takes about 2 min, this results in the cluster shown. At twice the frequency is a second cluster, caused by the heartbeat not being purely sinusoidal, which results in harmonics. Finally, the cluster at f = 0.25 Hz is due to respiration, which as a mechanical signal is also detected by the vibrometer. So, in addition to cardiac activity, the vibrometer can also be used to detect respiration! The heart activity is extracted from the vibrometer signal by high-pass filtering with the cut-off frequency fg = 0.58 Hz.
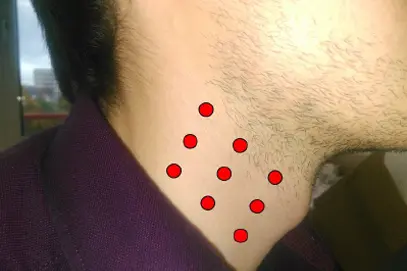
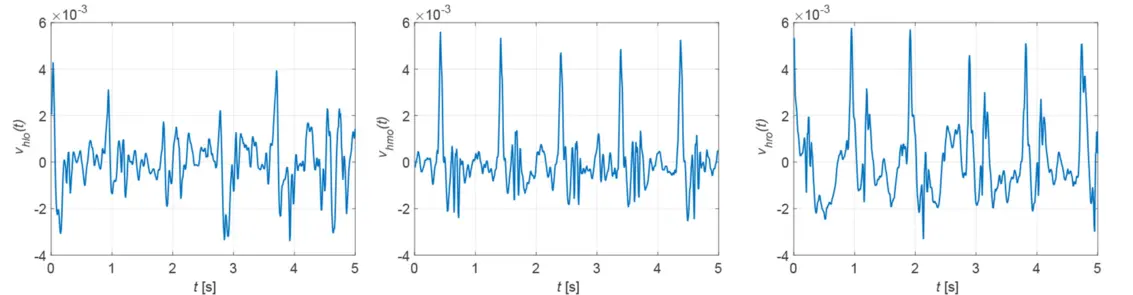
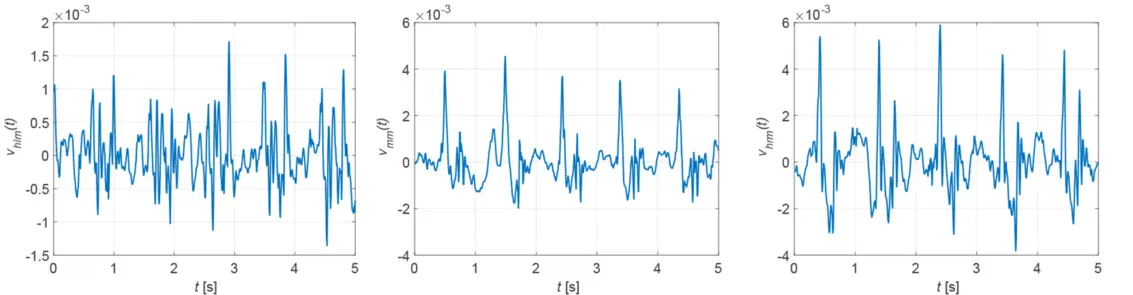
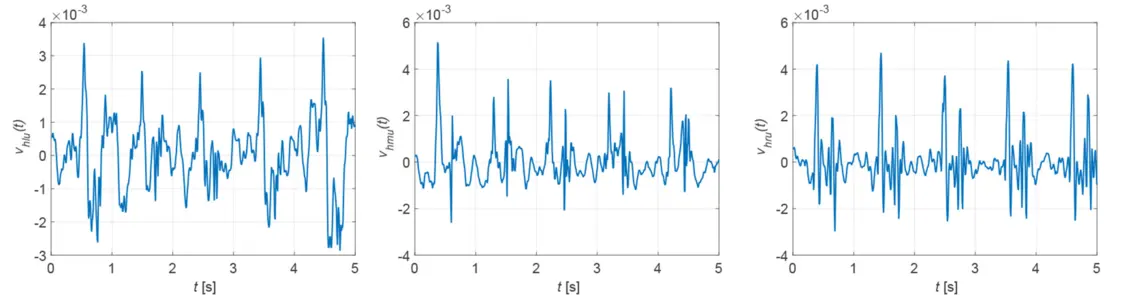
The closer to the heart the measurement is taken, the more suitable the vibrometer signal becomes for determining the heart rate. If the surface of the chest is covered by clothing to such an extent that the vibrometer signal can no longer penetrate it, a different measurement location is required. Because the neck is usually uncovered, the carotid artery is an alternative measurement site. Figure 3 shows nine possible measurement locations. The quality of the measurement signal depends on the measurement site and the distance to the carotid artery, as shown in Figure 4. The best measurement signals are obtained at the middle and right measurement points. The heart rate must be calculated from the samples x[k] of the measurement signals. For this purpose two methods are available: the evaluation of the magnitude spectrum |[X[n]| or the autocorrelation function rXX[κ].
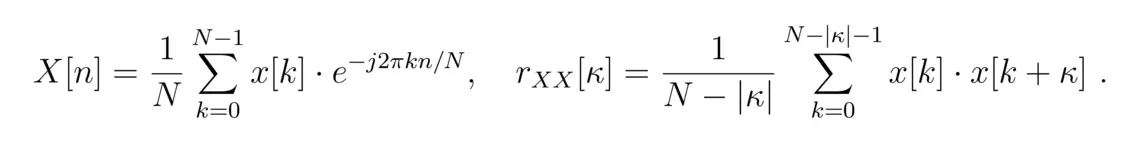
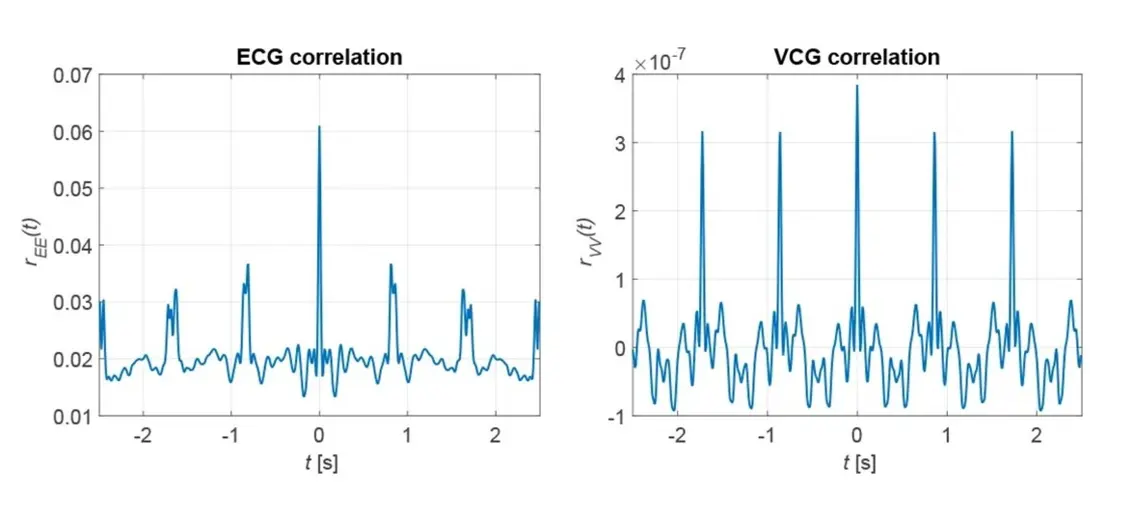
The desired heart rate is found either in the spectrum where it is represented by the maximum peak or alternatively in the correlation function as the reciprocal of the distance between the maxima. For the two measurement signals x[k] in Fig. 1, Fig. 5 shows the corresponding correlation functions. The periodicity of the measurement signals x[k] is also found in their correlation functions rXX[κ]. The spectral resolution and thus the accuracy of the determined heart rate is limited for the spectral method by the sampling frequency - here fs = 120 Hz - and the number of samples - here N = 600 - to Δf = 0.2 Hz.
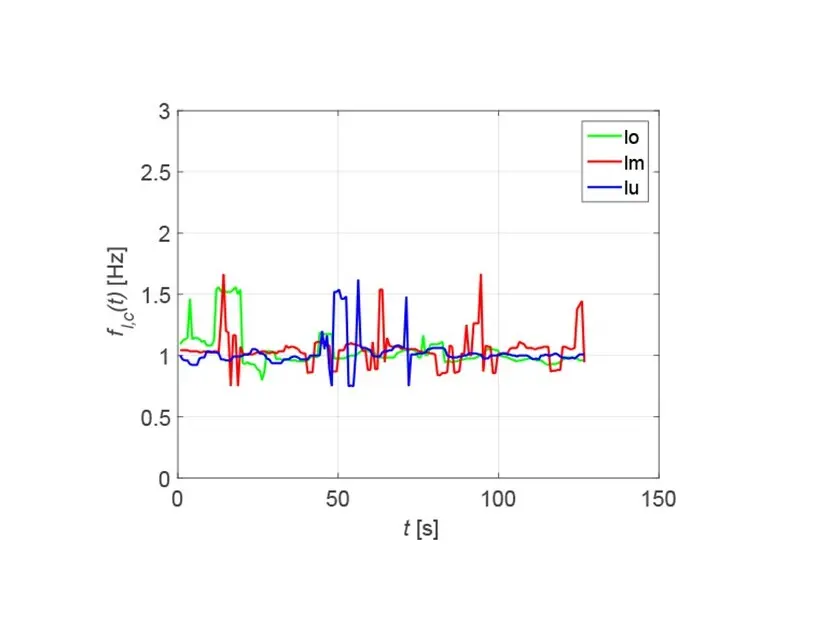
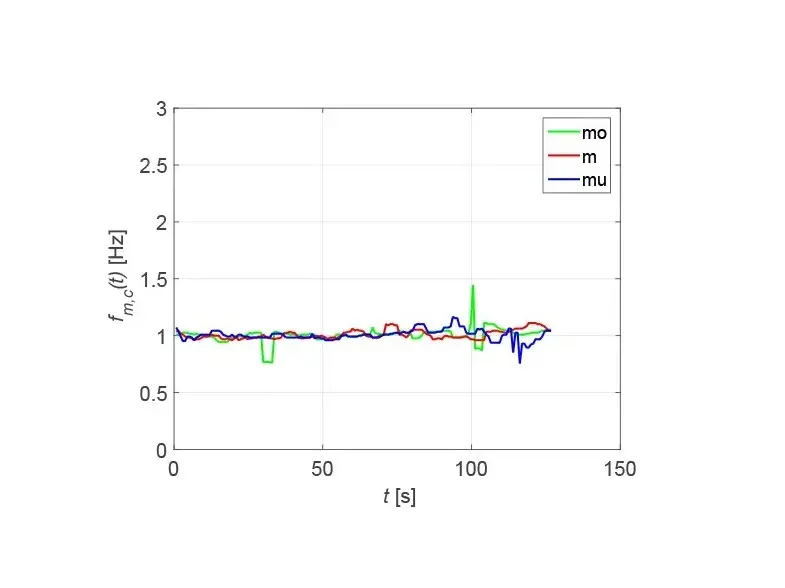
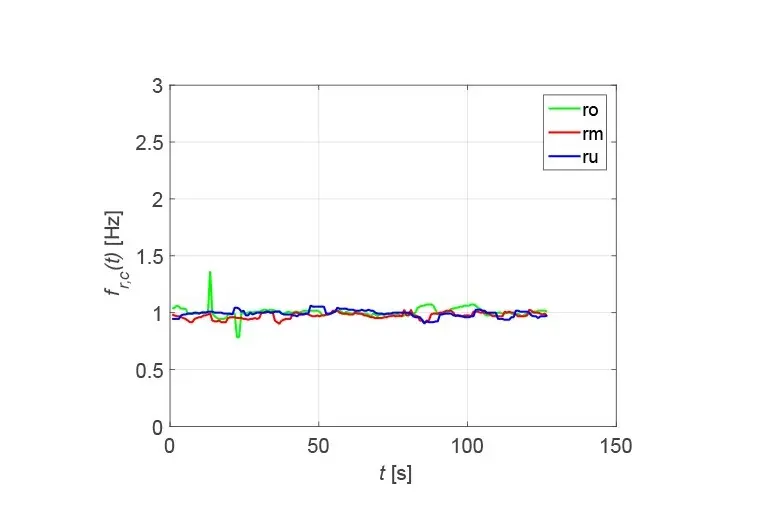
By zero-padding the resolution can be increased at the expense of the accuracy. For the correlation method, the frequency-dependent spectral resolution at a heart rate of f = 1 Hz or 60 bpm is Δf = 8.23 mHz or 0.49 bpm. Therefore, the correlation method is the preferred approach, especially since it is possible to determine the best measurement point on basis of a criterion derived from the correlation function. The heart rates determined for the measurement signals in Fig. 4 are shown in Fig. 6, where the green curves are assigned to the upper, the red curves to the middle and the blue curves to the lower measurement points.
The determined heart rate is about f = 1 Hz and is most stable at the middle and right measurement points, as already suspected when looking at Fig. 4. In particular, the right measurement points show the fewest outliers, which may be caused, for example, by movement or coughing of the patient.
Detection of cardiac fibrillation
In cardiac fibrillation - more precisely the ventricular fibrillation - the heart rate deviates from its normal value and can be elevated up to f = 5 Hz or 300 bpm. This causes long-term damage to the heart, so its detection is important. The patient usually does not notice anything until damage to the heart has already occurred. Figure 7 shows sections of ECG and VCG in the presence of cardiac fibrillation.
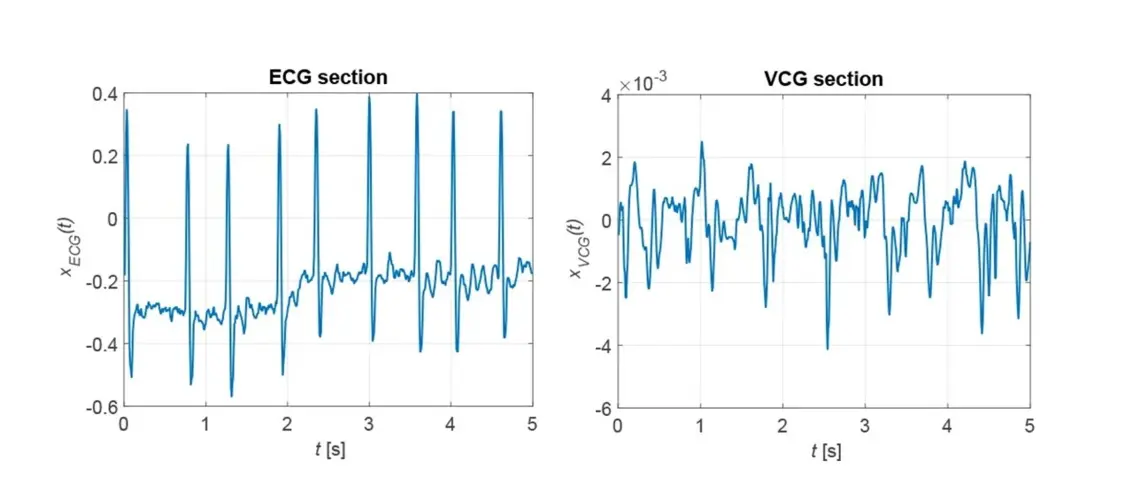
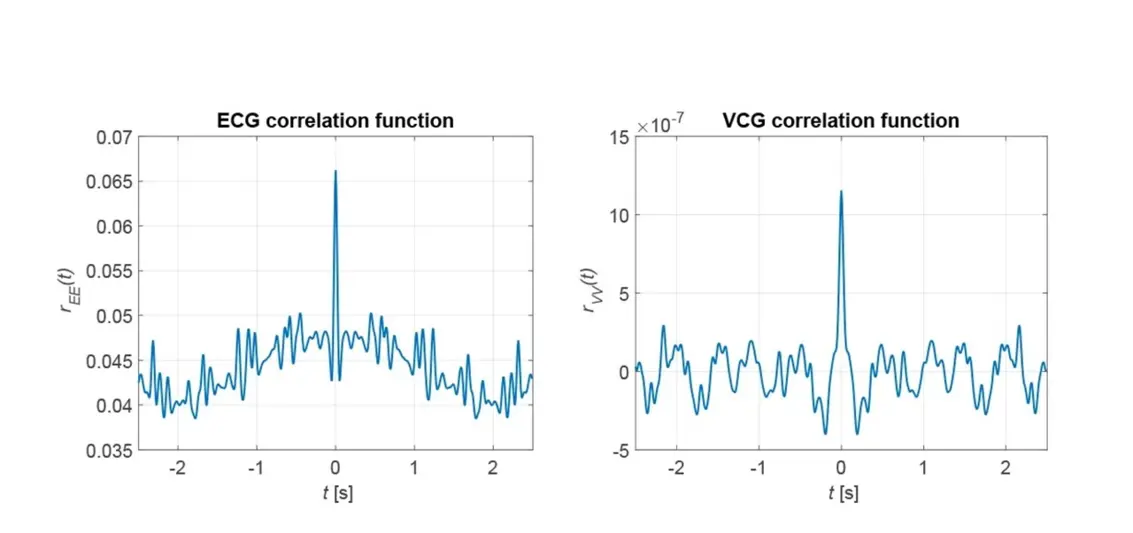
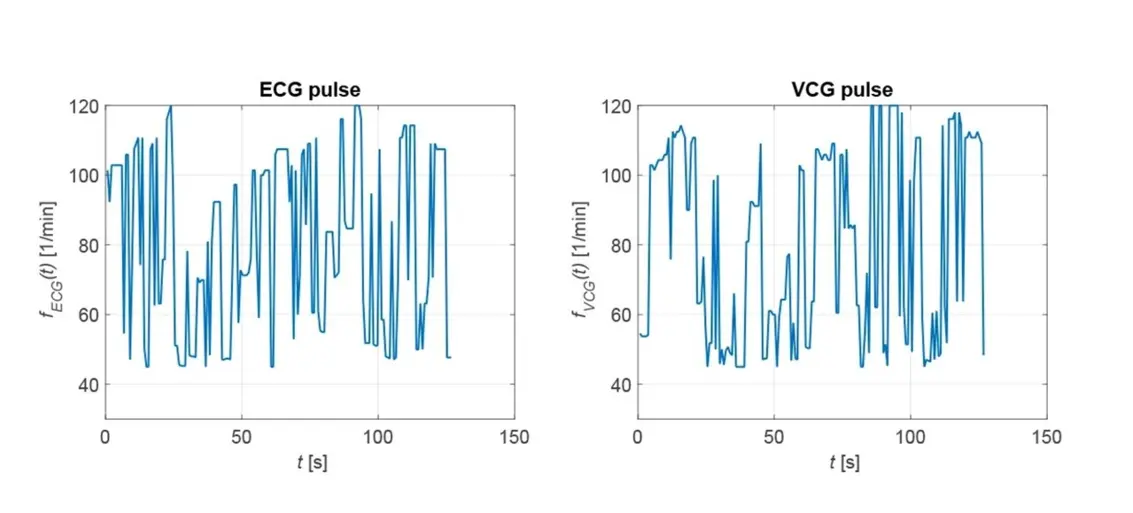
On the ECG, the irregularity of the heart's activity can be seen in the changing intervals between the maxima. In the VCG, pronounced maxima are not present at all. This leads to the fact that no pronounced secondary maxima can be recognized in the correlation functions. From this, a criterion for the automatic detection of atrial fibrillation can be derived. The irregularity of the cardiac activity can also be seen in the heart rate calculated via the correlation function, as shown in Figure 8.
The fluctuating heart rate is typical for cardiac fibrillation, which can be seen in both the ECG and the VCG, ranging from 45 bpm to 120 bpm.
Outlook
In the presented study, it was demonstrated under hospital conditions that non-contact measurement of cardiac parameters, in this case the heart rate and ventricular fibrillation, is possible with the specified accuracy. In addition, with the appropriate signal processing, it is also possible to measure heart sounds and respiration without contact. This completes the task for research for the time being.
Now it is up to suitable medical technology companies to develop manageable and affordable devices based on those findings, which certainly is not an easy task. But it would prevent many people from dying prematurely from heart disease.
Acknowledgements
Contributions to the presented project have been made, among others, by Dr. Laura Mignanelli from KIT, Dr. Armin Luik from the Karlsruhe Municipal Hospital, Dr. Marko Wolfer from Polytec, and Dr. Jürgen Metzler from Fraunhofer IOSB, for which they are thanked. Thanks are due to Springer Verlag for publishing the book Kristian Kroschel, (ed.) Laser Doppler Vibrometry for Non-Contact Diagnostics ISBN 978-3-030-46691-6, Springer Nature Switzerland AG 2020