Why the acoustics of electric drives are crucial
Electric machines are increasingly being used as the primary drive technology in vehicles. The acoustic behavior of the drive is a key factor in the perceived quality of electric vehicles. Numerical methods for evaluating and optimizing acoustic behavior are therefore used early in the development of electric drives. The structural-dynamic response of the motor plays an important role in the evaluation of amplitudes. As the predictive capability of current damping models is limited, especially for electric drives, efficient measurement methods are required for model validation.
In electric drives, acoustic excitations occur in the entire audible frequency range. For example, the control of the machine with modern power electronics generates forces and noises in the higher kHz range, which are often perceived as particularly disturbing. This poses challenges for the experimental investigation of electric drives.
Many measuring points are required to clearly reconstruct the sometimes complex deflection shapes in the higher frequency range. In addition, the behavior of electrical machines is sometimes non-linear due to their mechanical structure.
With Polytec's state-of-the-art robot-assisted 3D laser Doppler vibrometers, it is possible to provide an answer to these particular challenges in the acoustic analysis of electric drives. The optical measurement method minimizes the influence of the test setup on the measurement results and simultaneously records an almost unlimited number of measurement points. Laser Doppler vibrometers with QTec technology enable a significantly increased signal-to-noise ratio. This reduces the measurement time, increases the evaluable frequency range and enables reliable attenuation estimation.
The properties described above are examined below using the example of the experimental modal analysis of an electric drive.
Precision in perfection: How vibrations are made visible
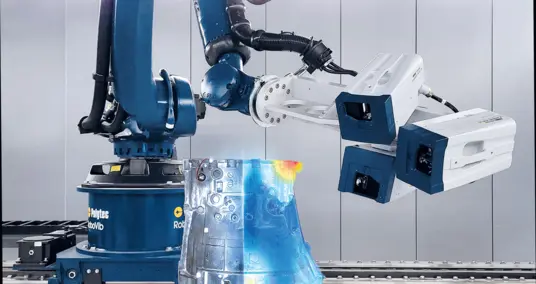
The experimental modal analysis is carried out in the fully automated RoboVib test center. The aim of the experimental modal analysis is to describe the structural-dynamic transmission behavior based on the natural frequencies, eigenvectors and damping and to compare it with the numerical model.
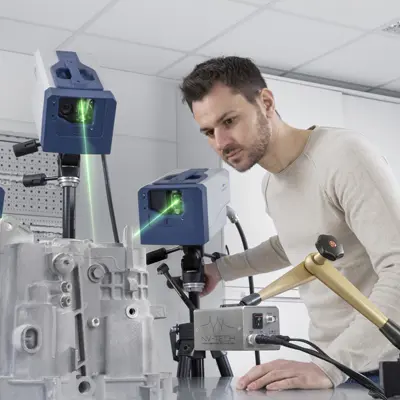
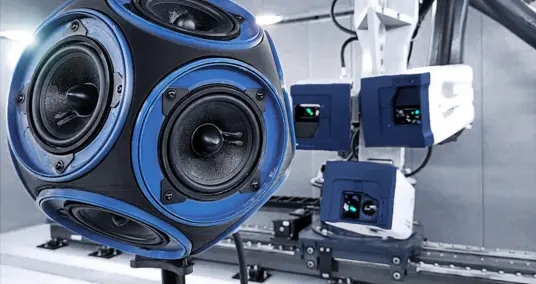
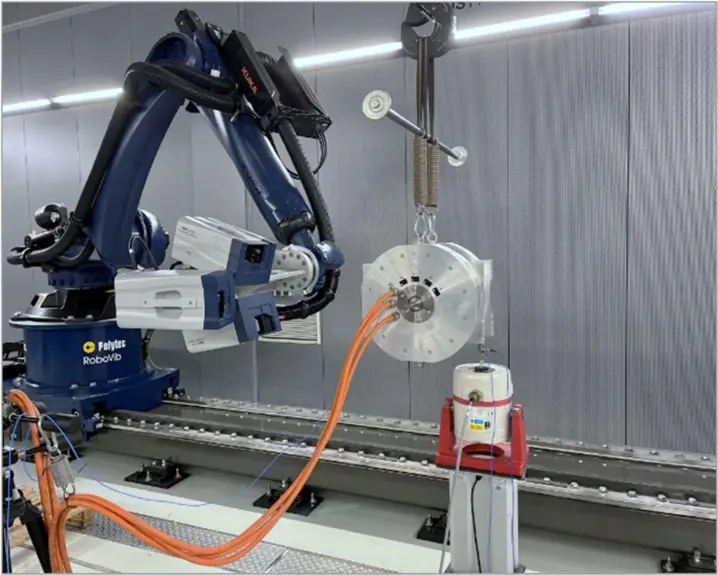
Figure 1 and Figure 2 show two selected test setups from the measurement campaign. The electric drive is elastically suspended with springs to reduce external influences. The spring stiffness of the suspension is selected so that the natural frequency of the suspension is sufficiently far away from the first expected natural frequency of the machine to minimize the influence of the suspension on the damping behavior of the machine.
Various methods and excitation signals are available for the defined excitation of the machine in the modal analysis. On the one hand, excitation with a shaker from LDS using pseudo-noise and white noise and, on the other hand, excitation using an automatic modal hammer from NV-Tech are investigated. To avoid plastic deformation when using the automatic modal hammer, thin hardened steel plates are attached to the excitation points. The points for optimal excitation of the structure are determined in advance using specially developed methods, considering the test boundary conditions in the numerical model.
Two different laser Doppler vibrometers (PSV Xtra and PSV QTec) are used in the RoboVib test center to measure the vibration response.
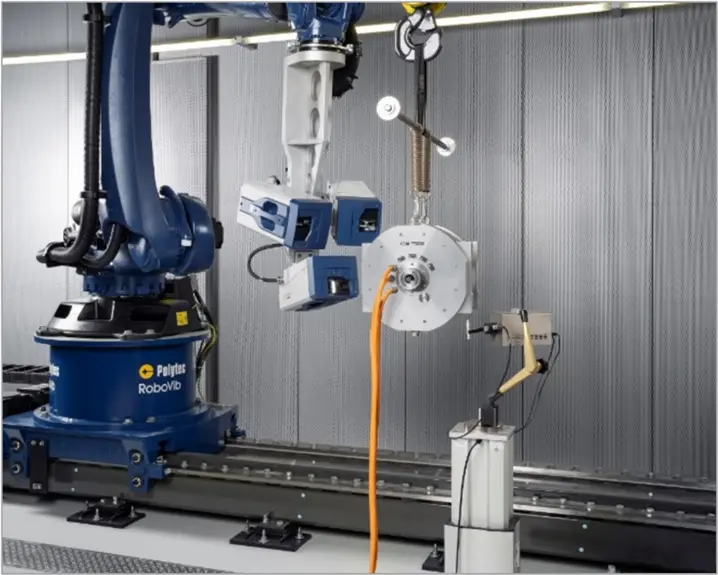
Due to the curved surface of the electrical machine, different positions of the vibrometer must be used for optical measurement. The RoboVib measurement system performs these measurements with repeat accuracy and fully automatically with a total of 17 positions (see video).
How QTec technology is revolutionizing signal quality
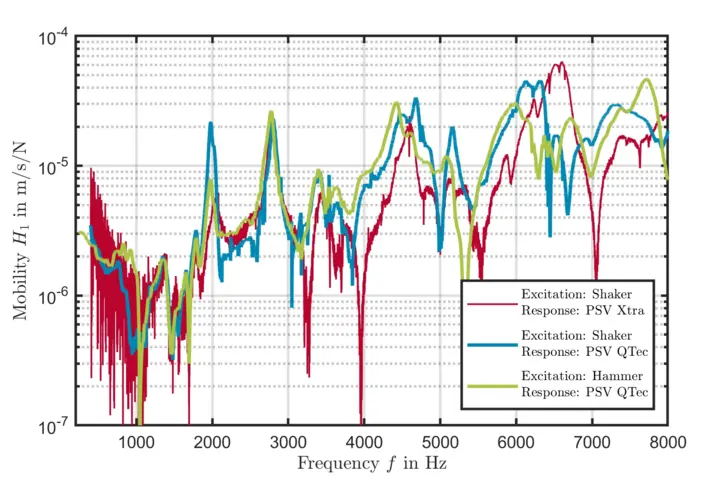
Figure 4 shows an example of the results of a transfer function to compare the test setups: excitation using a shaker or automatic modal hammer and measurement of the vibration response using the PSV Xtra or the PSV QTec.
The setup with shaker and PSV Xtra shows a strong noise component in the transfer function in the entire frequency range. In contrast, the noise component can be significantly reduced when using the QTec system. The use of an automatic modal hammer instead of the shaker leads to a further improvement in the quality of the measurement data.
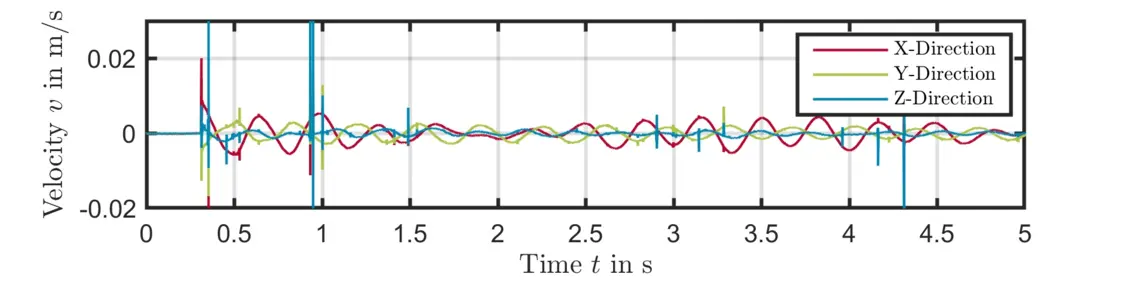
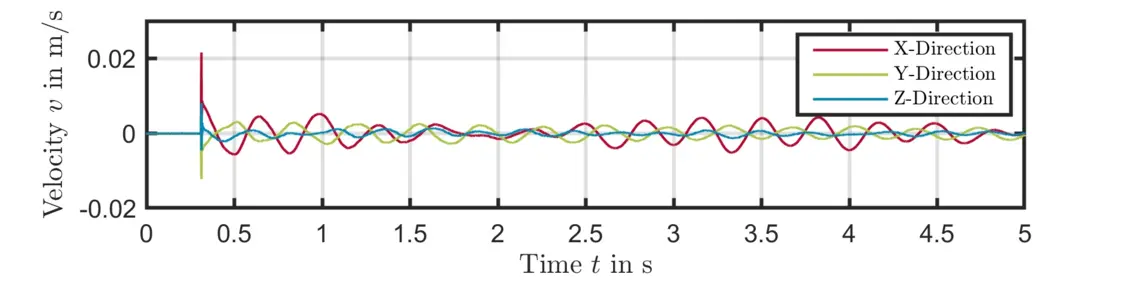
Figures 5 and 6 show the time signals of the measured surface velocity with and without QTec technology for a selected measurement point when excited with the automatic modal hammer. Due to the test setup and the necessary elastic mountings, the transverse movements of the machine lead to signal drop-outs if no QTec is used.
QTec's multi-path detection can completely avoid these signal drop-outs and thus significantly improve the signal quality for this application.
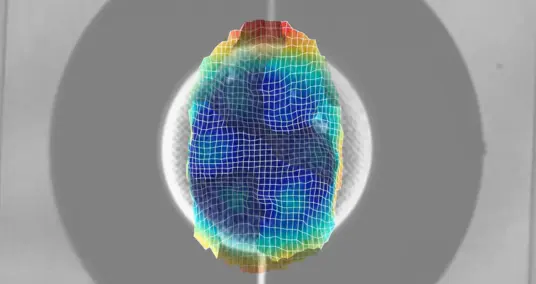
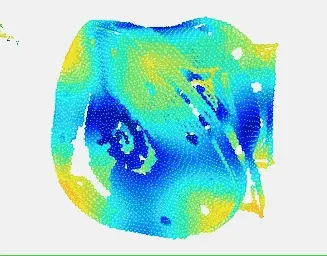
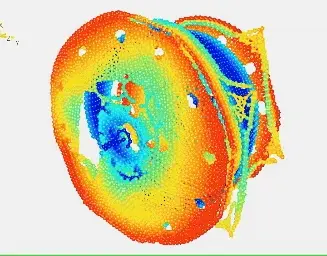
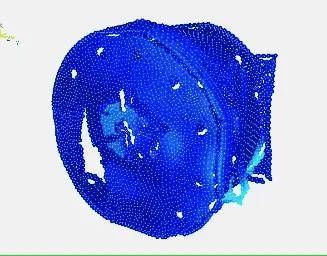
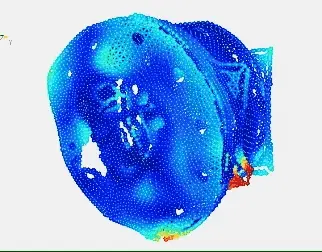
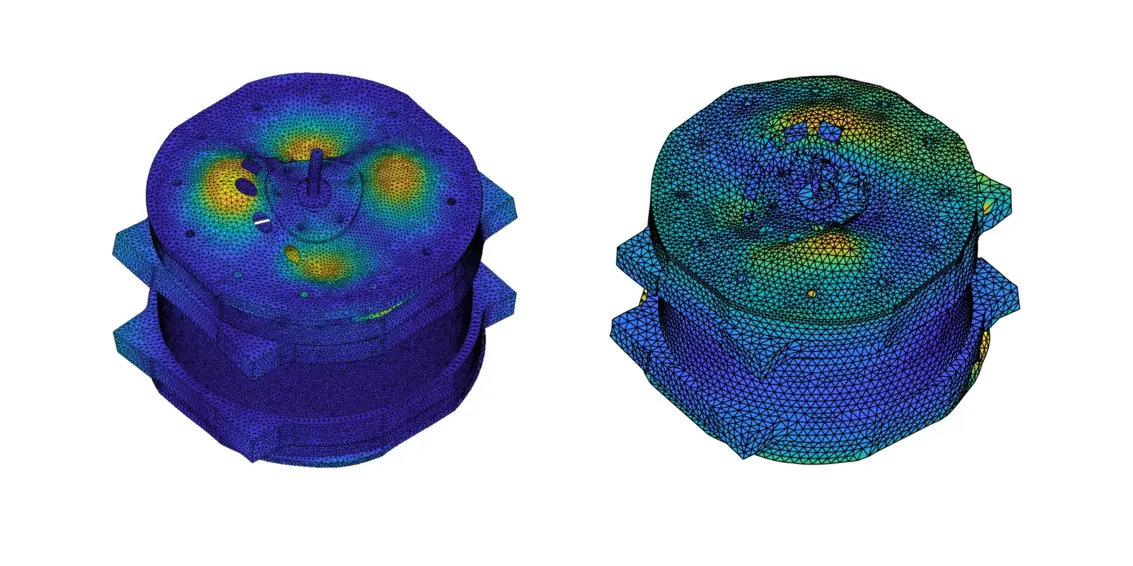
Overall, the test setup with automatic modal hammer and QTec vibrometer makes it possible to carry out an experimental modal analysis of the electrical machine up to 12 kHz. The following illustrations show exemplary deflection shapes at selected resonance frequencies of 2.8 and 4.6 kHz as well as 6.2 and 9.8 kHz.
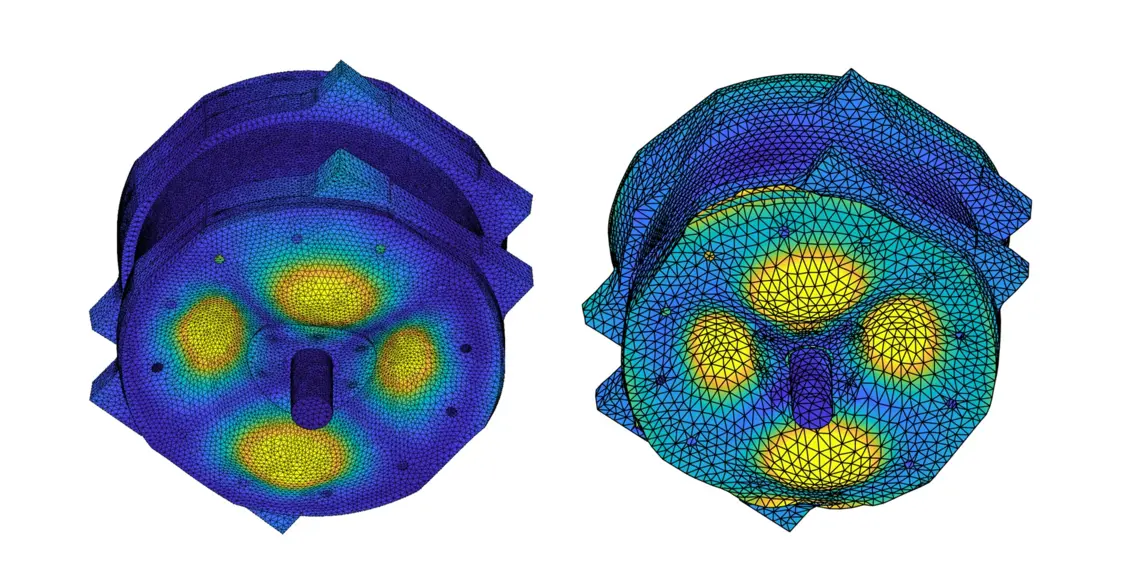
Limits of simulation: what we learn from measurements
A correlation between measurement and simulation shows for a frequency, for example, that there is a high degree of agreement between the model and measurement on the front of the machine (Figure 9a). On the rear side of the machine (Figure 9b), the mode shapes do not match locally. This suggests that with current modeling methods, the influence of the wiring of the electrical machine cannot be sufficiently taken into account in this frequency range.
To summarize: New standards for acoustic analysis
With the latest robot-assisted 3D laser Doppler vibrometers from Polytec, it is possible to provide an answer to the special challenges in the acoustic analysis of electric drives. Thanks to the complete automation of the measurement, enough measuring points can be realized for the higher kHz range. The optical measurement method minimizes the influence of the test setup on the measurement results. The signal-to-noise ratio can be significantly increased using laser Doppler vibrometers with QTec technology. This reduces the measurement time, increases the evaluable frequency range and provides a reliable attenuation estimate.
A correlation with numerical models also shows that the vibration behavior of electrical machines cannot be described with high accuracy over the entire frequency range using current calculation methods. This means that the current calculation methods cannot completely replace a measurement.