One of the workhorses of medical imaging is ultrasound imaging, often called (diagnostic) medical sonography. The advancement of transducer technology for creating the ultrasound waves is a very dynamic subject in medical ultrasonic R&D.
Capacitive micromachined ultrasound transducers (cMUTs) are very promising transducers for such ultrasound applications. Compared with conventional piezoelectric ultrasonic transducers, cMUTs inherently exhibit many unique features.
The flexural mode of the cMUT membrane reduces the mechanical impedance of the devices and improves the energy coupling with the ambient medium. Moreover, mircofabrication capabilities make them easy for a low cost batch production with fine pitches.
Besides, cMUTs also benefit from the underlying CMOS circuit, because the closer driving and read-out circuit means a better signal-noise- ratio. Electrical interconnection issues are also solved, which enables large scale 1D or more complicated 2D array configurations. Given the above facts, cMUTs have been recognized as being very suitable for next generation ultrasonic diagnostic imaging. In the past two decades, ultrasound imaging prototypes based on cMUTs have been reported by several groups. However, the study of individual cMUT cells, both in FEM (and analytical) modeling and in experiments, is often not addressed.
In fact, the accurate prediction of output pressure and corresponding frequency response provides useful and important information for the design of ultrasonic transducers. We have used both FEM simulations and optical scans to obtain the transducer surface transient response, and then the results are utilized to construct the spatial pressure field by the Rayleigh integral method. Output pressure of the cMUT is also detected by a hydrophone, and the results of simulation and measurement are compared.
Device and technology build-up
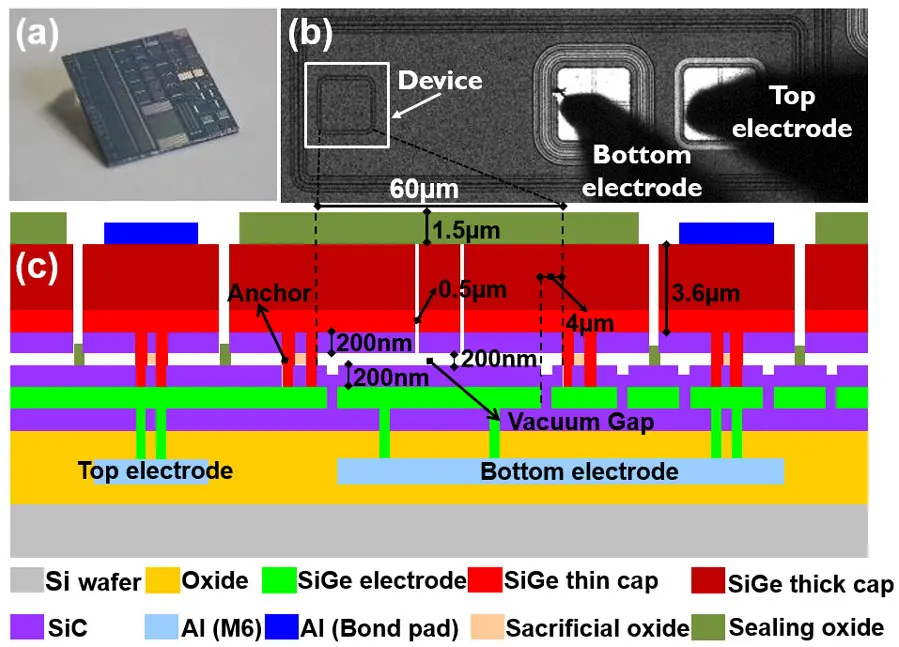
An isolated square cMUT cell with rounded corners is chosen for the study. Isolating the cell has the advantage that any disturbing neighboring effects such as crosstalk, anchoring and so on are reduced to negligibly small levels. Figure 1(a) is the top view of the device; the diameter of the square membrane is 60 μm, and there are two probe pads, the one closest to the device is connected to the bottom electrode and the other is connected to the top electrode. When the DC and AC voltage are applied to the two pads separately or superimposed on one pad and the other one is grounded, the membrane will vibrate and the corresponding ultrasound wave will be generated in the load medium. In this paper the device is actuated in two mediums: air and a specific fluorinert FC-84 (from 3MTM, USA).
Measurements: Optical and acoustic
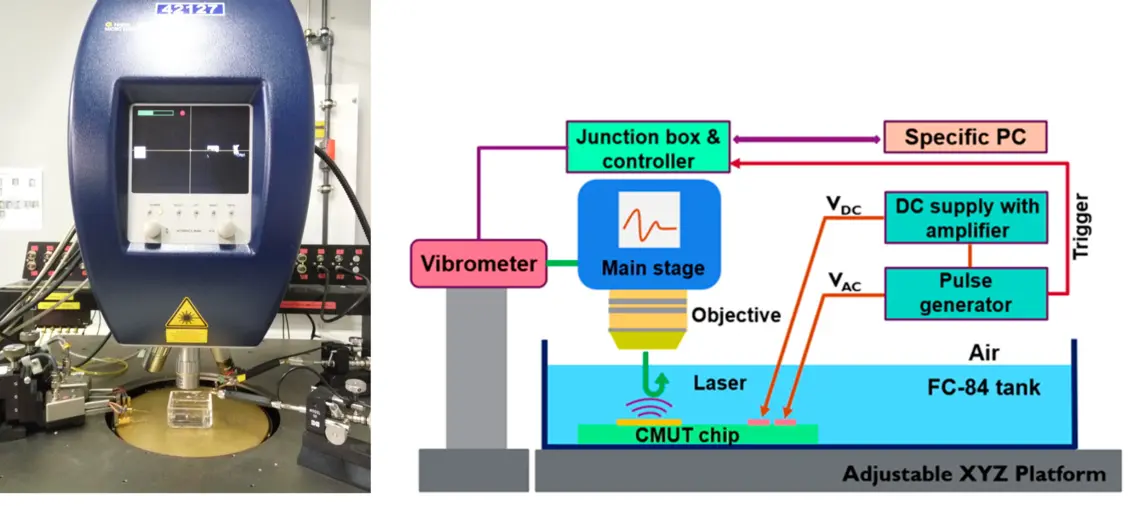
The dynamic behavior of the cMUT cell is studied using the Polytec’s MSA Micro System Analyzer Laser Doppler Vibrometer . The experimental set-up is depicted in figure 2(a). The cMUT cell is immersed in FC-84 fluid which has a depth of around 5 mm.
A +60 V, 50 ns duration pulse from a pulse generator is applied to the pad connected to the bottom electrode of the cMUT cell. A -160 V DC bias which equals 60% of the theoretical pull-in voltage is applied to the other pad. Polarities of the pulse voltage and the DC bias are such that effective voltages add up. Measurements were performed in air and in FC-84. A correction is performed for the FC-84 measurement, by dividing the measured displacement by 1.261, which is the refractive index of FC-84.
Dynamic (resonance) response
According to acoustic theory, some fluid will vibrate together with the transducer as an amount of mass (called the radiation mass) attached to the transducer surface. The radiation mass will lower the membrane resonant frequency (or the center frequency in the pressure frequency response plot). In order to evaluate the effect of the fluid load, the frequency response characteristics of the cMUT cell is evaluated in both air and FC-84.
Results for air:
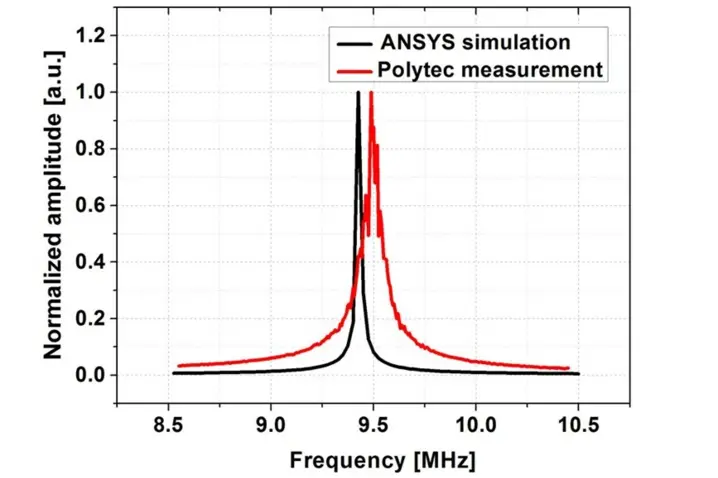
In an ANSYS simulation, the cMUT cell is initially stressed by a constant 160 V DC bias, and then a prestressed harmonic simulation is performed. The displacement of the central point is evaluated and normalized to the maximum displacement (figure 3). In air, a resonance peak is simulated around 9.43 MHz, while the Polytec measurement gives a peak response at 9.5 MHz. The center frequency mismatch between FEM simulation and measurement is negligibly small. However the difference in the observed Q-factor is significant.
The Q-factor is characterized by the -3 dB bandwidth of the resonance response relative to its center frequency. The Q-factor 496 obtained from ANSYS simulations is about two times larger than the measured Q-factor 232. This is considered reasonable, since besides the air damping losses there are no additional losses taken into account in the simulation. Therefore, the air damping is negligibly small and the material damping and/ or the support or anchor (losses) damping are dominating.
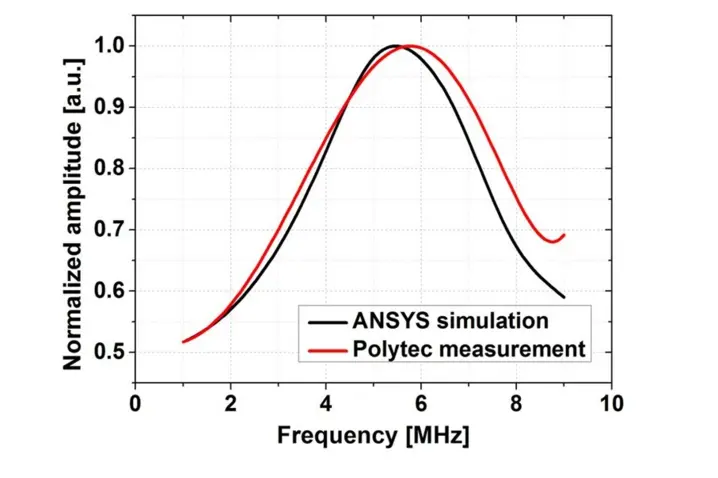
Results for FC-84:
Similarly, a comparison is also done in FC-84 (figure 4); a polynomial fit is used to reduce the noise in the fluid measurement. Both the simulation and experiment show a clear shift in the resonance frequency compared to measurements in air. The center frequency in FC-84 is around 5.5 MHz (compared to 9.5 MHz in air). This downshift is attributed to the significantly larger radiation mass of FC-84 as compared to air. The Q-factor observed in FC-84 is also largely reduced as compared to the Q-factor in air. The Q-factor in FC-84 between simulation (Q-factor = 1.2) and measurement (Q-factor = 1.1) matches much better than the result in air due to the dominated fluid damping, and a Q-factor lower than one is obtained which illustrates the high bandwidth nature of the cMUT cell.
Dynamic (displacement) response
A pre-stressed transient simulation in ANSYS firstly requires a transient simulation without the transient effect (ANSYS command: timint, off) and to apply a constant 160 V DC bias only, and then a normal transient simulation with a pulse superimposed on the 160 V DC bias is performed. Considering the delay in the Polytec measurement, 175 ns time duration is set for the transient simulation without the transient effect which means the 60 V, 50 ns duration pulse is applied at 175 ns. The displacement of the central node is evaluated again. There is no static defection in the Polytec data, and so the measured displacement is adjusted in order to compare with the simulation.
Results for air:
Dynamic responses of the cMUT cell in air using ANSYS simulation and Polytec measurement are shown in faigure 5. A good amplitude match is found over the first several cycles. Due to the resonance frequency and Q-factor mismatch, the difference between simulation and measurement becomes significant after several cycles. However in the measured case, because of the additional damping (material damping, anchor losses) besides the air damping, the response is expected to decay much faster than for the simulated cases.
Results for FC-84:
A similar simulation and measurement is repeated in FC84. Medium damping becomes significant when the device is immersed in FC-84, and the transient displacement signal is quickly damped both in the simulation and the measurement (figure 6).
Conclusions
In this paper a clear correlation study between FEM simulation and experimental studies of an individual cMUT cell is presented, and a clear understanding of the cMUT cell behaviors is demonstrated. Good agreements are obtained between the ANSYS simulation and Polytec measurements.
The corresponding spatial pressure results also match well with the hydrophone measurement results. This proves that ANSYS combined with the Rayleigh integral method is a fast and effective pressure field simulation method. We believe that this is very helpful for the design of complicated cMUT arrays for future imaging applications.