The validation of simulation models is an important application area of laser vibrometers. To do this, the geometric data from a finite element mesh is loaded into the software of the measurement system and brought into alignment with the real object using an integrated alignment process. Any geometric deviations between the model and prototype can be corrected and updated to the model with integrated geometry measurement. This facilitates highly precise, time-saving alignment of the simulation model with the experimental data.
Laser vibrometers offer many advantages over the classic process which involves affixing many acceleration sensors to the structure being tested. For example, during automotive modal test measurements for the alignment of FE simulation models, between 40 and 400 sensors are affixed to precisely calculated positions and precisely aligned in all three dimensions for the measurement. In the process, the Euler angles must be determined in order to align the measurement directions of the sensors with the coordinate system of the object on curved surfaces.
However, not only do mounting and adjustment take a lot of time; they also bring with them a high potential for error, since even the slightest inaccuracy in placing and aligning the sensors can result in measurement errors. At the same time, the sensors change the mass of the object, which also has to be taken into account, and the number of sensors cannot be increased as desired due to their size.
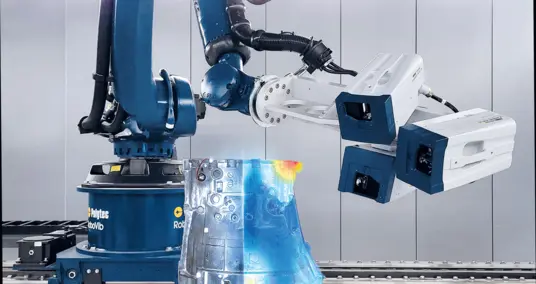
The laser beam of a scanning vibrometer, however, does not have any mass and the number of measurement points could theoretically be as great as desired; the corresponding geometry data can be directly recorded in the software of the measurement system from the finite element mesh in the simulation or in the CAD drawing. This is aligned with the real object using an integrated alignment process. Ultimately, measurement results obtained in this way are more precise, meaningful, and take considerably less time, especially if the laser scanning vibrometer is mounted on robot systems that carry out the tests automatically. Laser vibrometry and its automated variant, RoboVib®, offer a number of advantages that are best illustrated with a concrete example.
Test preparation within a few hours
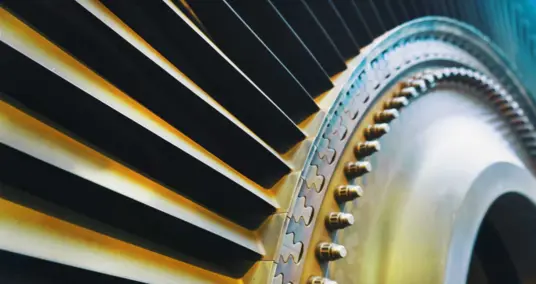
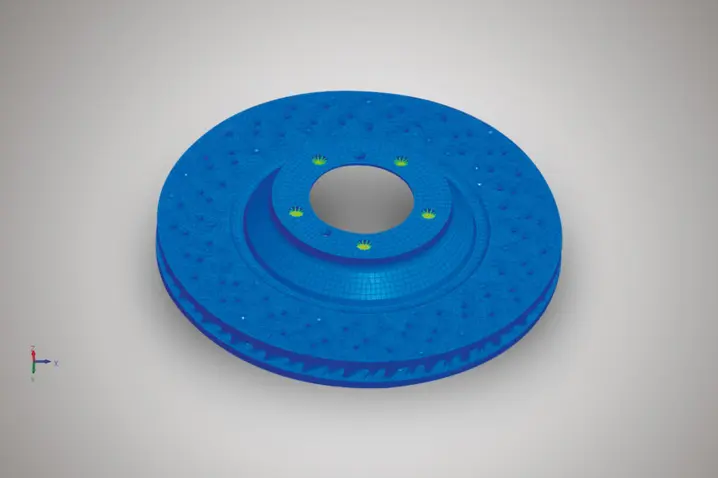
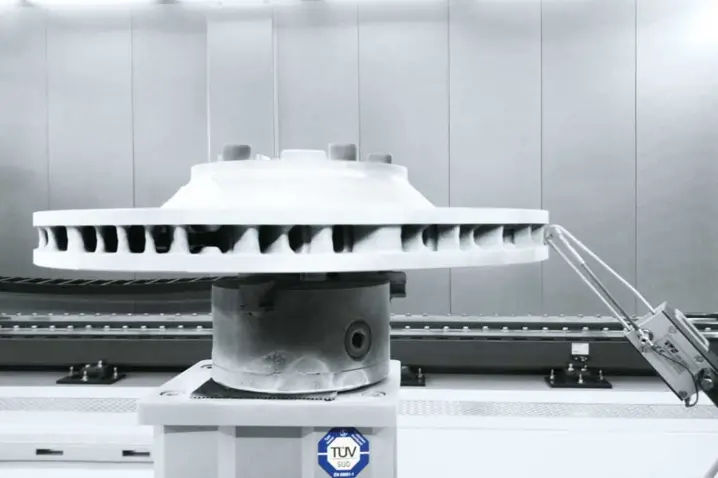
For the modal test of a brake disc, its FE shell model with approximately 150,000 nodes is imported into the software for the Polytec laser scanning vibrometer (figure 1). Four prominent points in the mesh help to teach the position of the object to the software. To accomplish this, the points of intersection of the laser beams were moved to these prominent positions one right after the other, the corresponding position of the robot arm was stored, and the corresponding coordinates from the FE mesh were assigned to these positions.
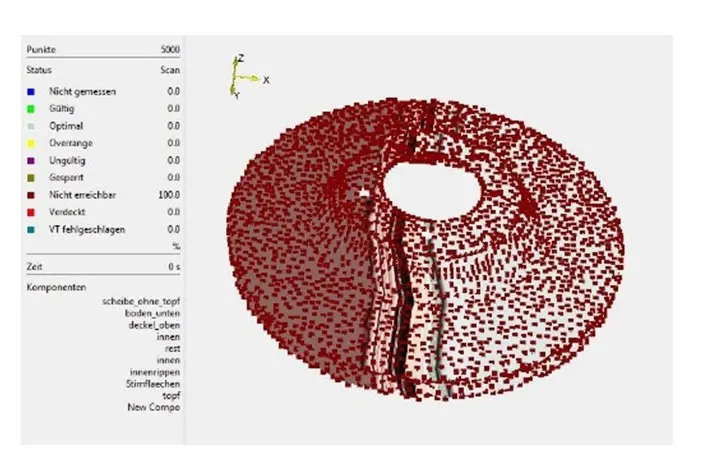
Then the imported FE mesh was coarsened to 5,000 points, since measurement with 150,000 points is possible, but very time-intensive (figure 2). Additionally, such a high spacial resolution as the FE method requires is not even remotely necessary, even for illustrating complicated vibration modes. To make it easier to determine correlations later, points were merely deleted during coarsening, not shifted. The 5,000 remaining points are situated at their original locations with their original indices.
In the next step, the approximately 20 robot positions, with which the entire object could be measured from all sides using the scanner mirror, were programmed. Teaching the reference points, programming the robot positions, and doing a test run of the program required only one workday. Now, the system is ready to begin the test. There is no need to monitor the test since the modal analysis with the RoboVib® runs automatically. It can, for example, also run through the night and is not dependent on business hours.
Detailed illustration of complex deflection shapes
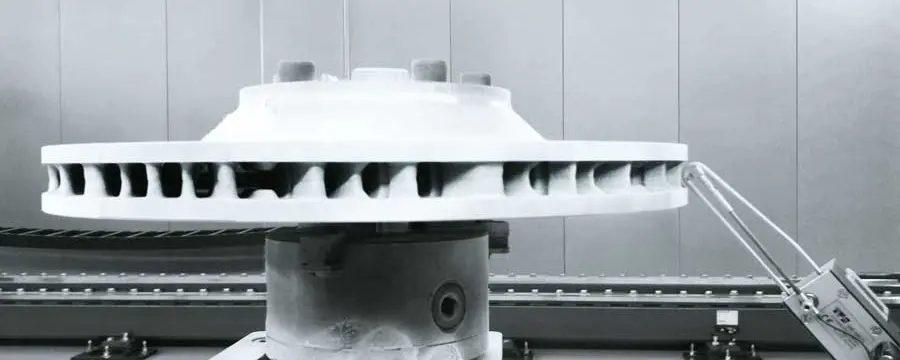
An automatic modal hammer hitting at an angle to the axis to excite as many modes as possible was chosen to provide excitation for the modal test of the brake disc (figure 3). The modal hammer eliminates the influence of an impedance sensor, which is always needed when an electrodynamic shaker is utilized. At the same time, it also allows for the excitation of far higher frequencies than needed for this experiment.
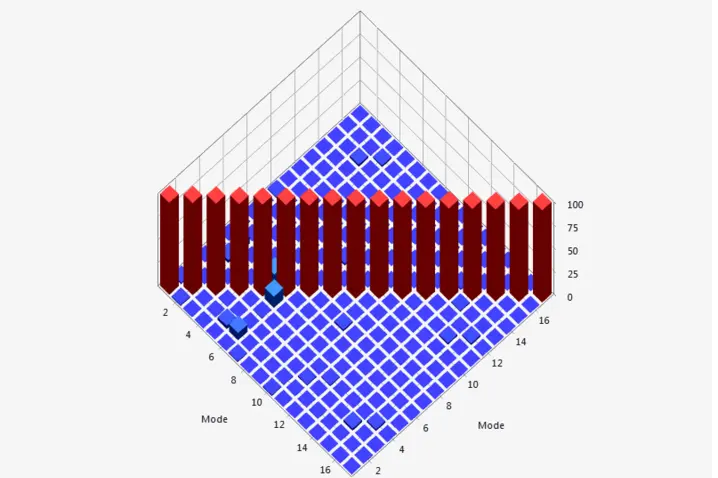
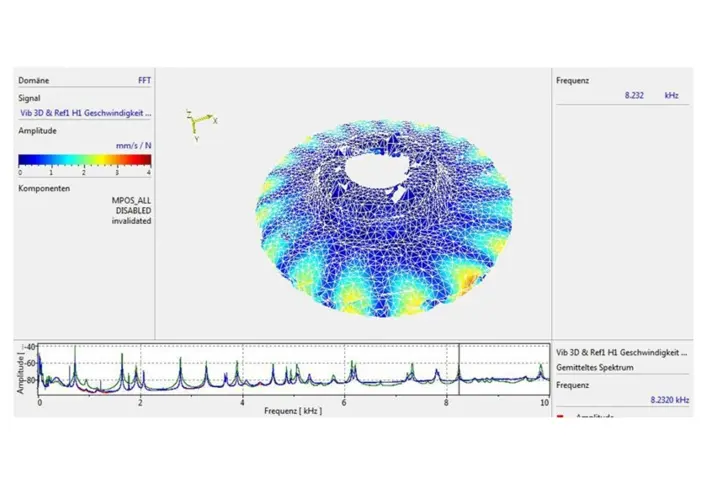
Frequencies up to 10 kHz were evaluated. This evaluation demonstrates that even complex deflection shapes can be illustrated in clear detail at higher frequencies (figure 4). Since this is a 3D measurement system, all three spacial components were captured. The measured data was then exported as a universal file and subjected to a modal extraction by FEM tools.
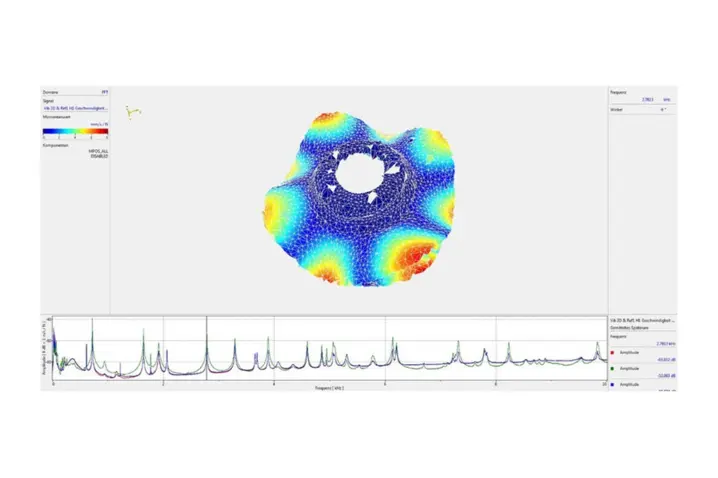
Even complex modes can be illustrated separately, thanks to the excellent spacial resolution and non-reactiveness (figure 5). These modes can be directly compared with those of the FE simulation. The quality of the FE model was checked and then the model parameters for the best possible fit were adapted to the real specimen.