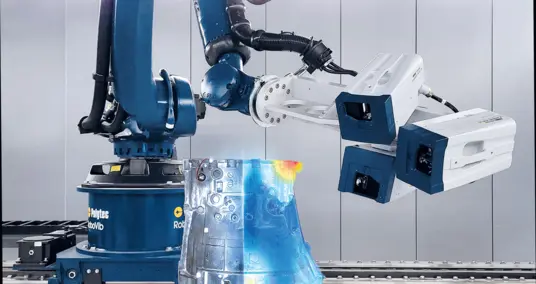
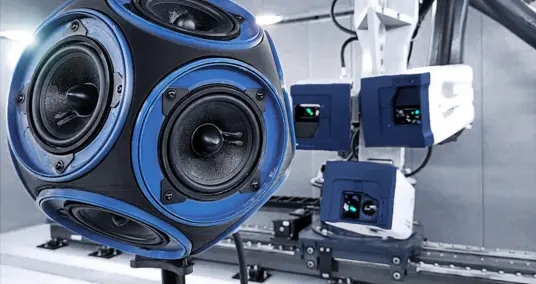
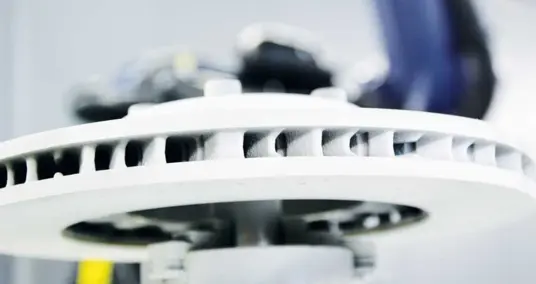
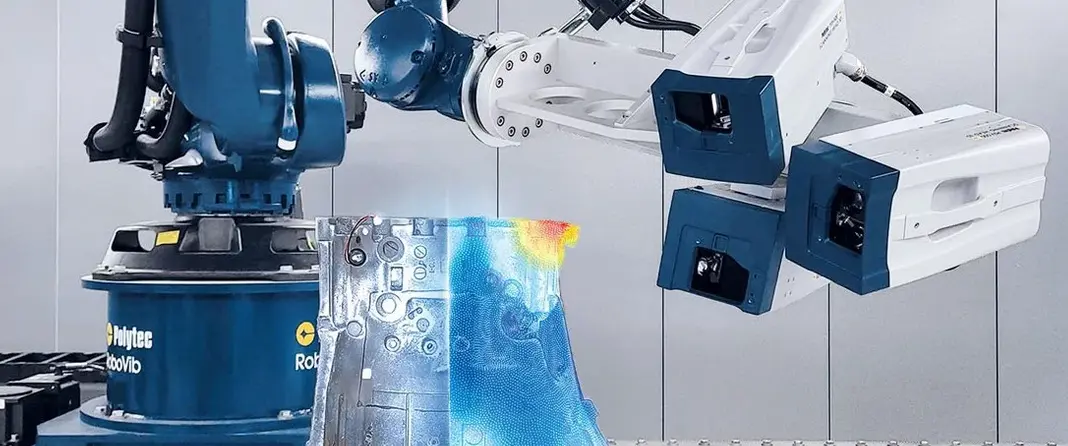
Artificial excitation is the basis for various noise and vibration techniques, from experimental modal analysis, over transfer path analysis, load identification, simulation model correlation, hybrid modelling etc. Structural excitation is possible by various means, from manual impact hammers over automated hammers, externally supported shakers (Figure 1) to self-supporting shakers.
Changing excitation mechanism for a changing testing ecosystem
We will first discuss some recent evolution in artificial excitation. Vibration and noise sensing equipment has gained resolution, both for operational testing and for artificial excitation testing. Commercial accelerometers, general measurement front-ends, and Polytec's laser scanning systems are now able to detect smaller signals in a reliable way. On top of this a significant higher force to size/weight ratio is possible. The combination of these two improvements has made it feasible to use very small and self-supporting shakers for a large range of applications. Figure 2 shows the size.
Minimize mass-loading
The next innovation is essential for self-supporting shaker applications. There is a risk of influencing the test-object dynamic behavior with the attachment of the shaker. Therefore, the suspension system inside a self-supporting shaker has to decouple the mass of the shaker from the test-object. For a traditional external suspended shaker, the external stinger provides such decoupling. The Qsources shakers use a patented suspension system to decouple all six degrees of freedom and still maintain alignment of the excitation. This internal suspension system is decoupling +-95% of the shaker mass (26 gram) from the test-object in the core application frequency range.
The internal suspension decouples the shaker body from around 270 Hz till the maximum frequency of around 13,000 Hz. This is resulting in around 1.5 gr of mass loading, which is smaller than most traditional stinger attachments and smaller even than many sensors. The suspension is very flexible to achieve a sufficiently low frequency decoupling. But correct axial or surface perpendicular force alignment is a major concern for external supported shakers and for hammer measurements. To achieve this the internal suspension of the Qsources Qlws shakers is self-aligning and does not require any adjusting by a measurement technician.
Force measurement at the excitation source
The last innovation concerns the force measurement. The integration of the force sensor in the suspended part of the shaker eliminates the need of an external force sensor. This again leads to a reduction of the mass loading of the test-object.
Some potential advantages of self-supporting shakers are:
- very small size allowing flexible use in difficult locations
- sufficient force level over a wide frequency range
- self-aligning in any application and inclination
- repeatable consistent alignment
- significant reduction of mass loading over a wide frequency range
- the shakers do not cause swaying of loosely suspended test-objects as observed in manual or automatic impact testing, which requires waiting for the sway to decay to an acceptable level
- compared to manual impact excitation the technician time and effort are reduced in any measurement situation
Especially for scanning applications, like the photo above, there is a considerable efficiency gain of shaker excitation relative to automated or manual impact excitation. In practice this allows scanning at a significantly higher density of points, higher frequencies, or a much smaller measurement time.
Scope of application – bandwidth and sample mass
The Qsources Qlws suspension system and force sensing is optimized for the core frequency range of 270 to 10,000 Hz. In this frequency range even light objects of around 0.5 kg, with some internal damping, can be measured accurately. Still, there are also limits to consider when using self-supporting shakers.
High frequency limitation. In applications above 10 kHz up to 13 kHz very light weight test-objects with high modal density the +- 1.5 gr coupled part of the shaker can still have an influence. Under +- 2 kg object weight, a shift in responses above 10,000 Hz may occur of more than 1 dB. Above 2 kg object weight this effect becomes negligible.
Low frequency limitation. Application of a Qsources Qlws shaker below the core frequency range of 270 Hz down to 100 Hz is possible on larger test objects of +- 100 kg or heavier. In this 100 Hz to 270 Hz frequency range the high accuracy obtained in the core frequency range may not be reached due to weak coupling effects of the shaker. For modification analysis, forced response measurements, troubleshooting, and for transfer path like applications this may not be very relevant because the requirements are generally lower and repeatability is not affected. But for modal analysis and FE model correlation the user should be aware of the risk.
A third limitation to mention is damping resolution. Any sensor, cables, bungee, and also the Qlws shaker will increase the damping of the test-object somewhat. This is visible on the peak transfer function responses on smaller objects below 1% modal damping. The eigen-frequencies are not affected, only the damping resolution is limited to +- 1% when measuring on light objects.
Light weight object example: carbon fiber bicycle frame
The application below is typical for experimental modal analysis or for an FE model correlation. The test-object a 1.6 kg carbon bicycle frame. Measured between 100 and 2,000 Hz. The curves which are shown use an excitation at the crank-bearing (A) and at the rear axle support (B). And responses were measured also at both ends. A traditional supported shaker measurement , as shown in the first photo in this article, did not lead to stable data due to force sensor mass and stinger stiffness loading and stinger modes. So, a comparison is made between a manual instrumented hammer and the Qlws shaker.
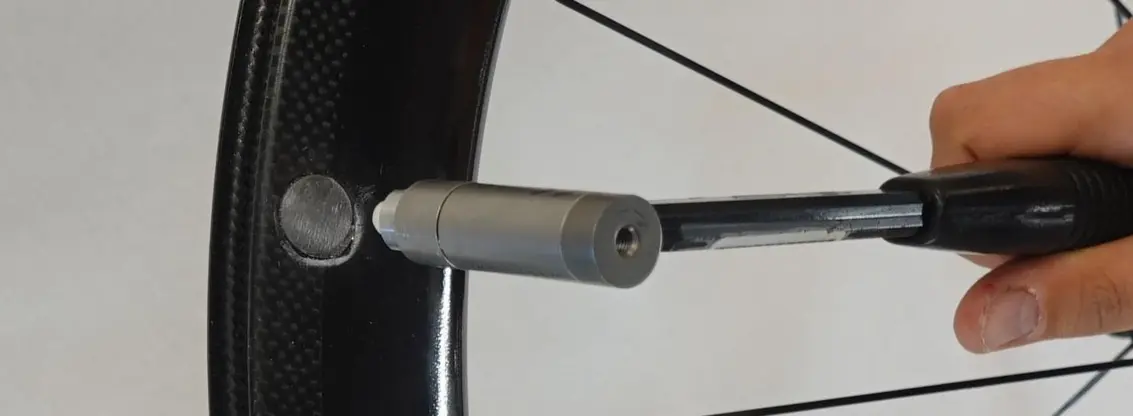
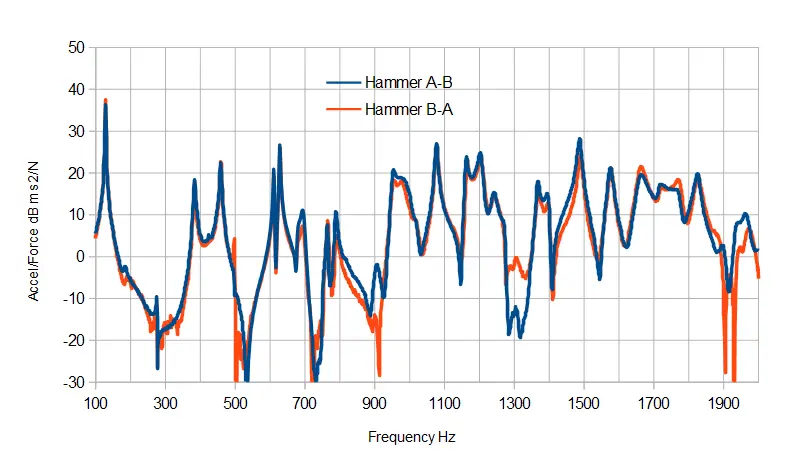
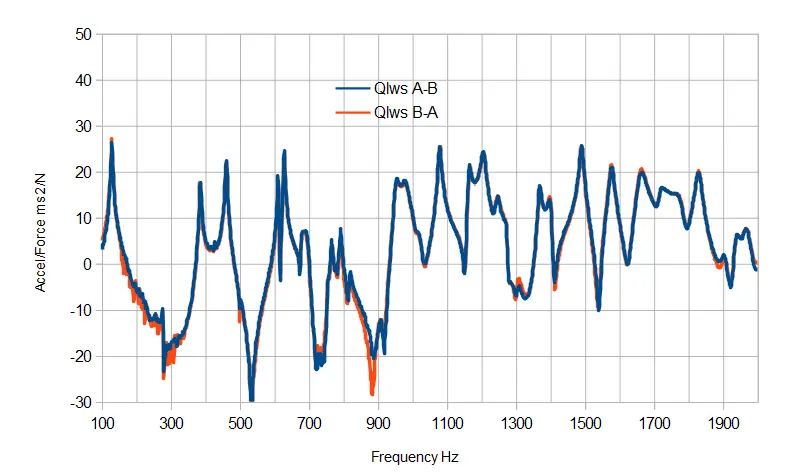
We concentrate on the reciprocity verification as a severe test on both repeatability, force and sensor alignment and sensitivity stability. Potentially a non-linearity in the test-object can limit reciprocity too, but this frame is very linear by nature. The first graph below shows that, in a careful test with hammer measurements, a good reciprocity can be obtained.
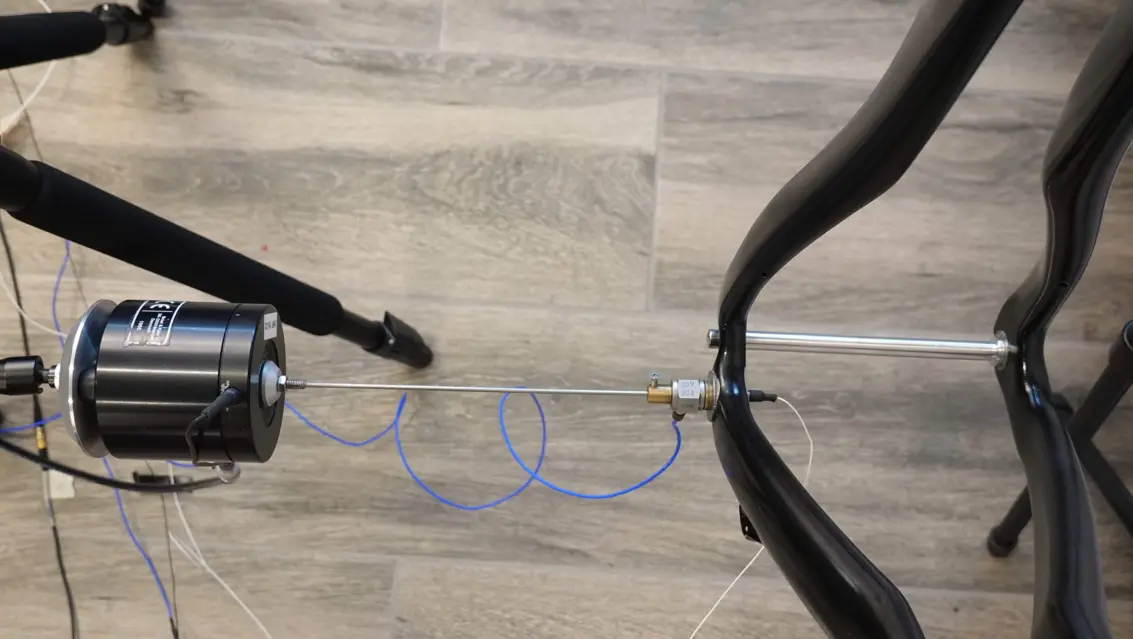
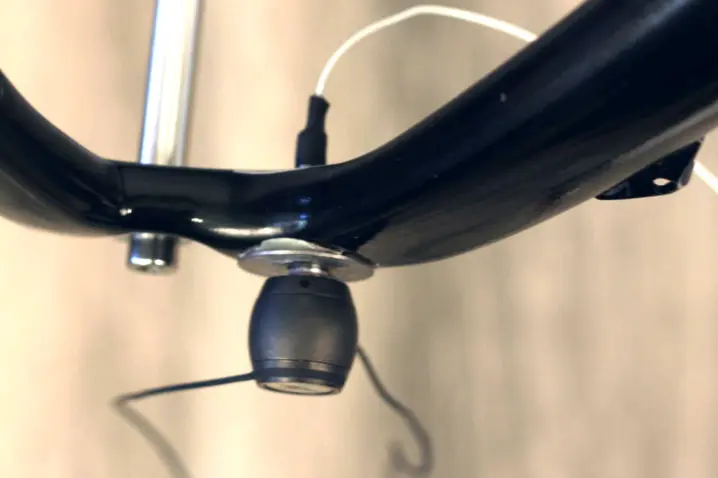
The measurement is repeated using two Qlws shakers, as in the photo below. A band limited random signal between 100 and 2,000 Hz was used. One shaker is activated and the acceleration response is measured at the location of the other shaker. Back and forth, providing the same information as the hammer measurements. The measurement repeatability was also verified and remained within +-0.5 dB.
The reciprocity result by the Qsources Qlws shakers shows a clear higher level of accuracy than the hammer measurements. Confirming the good linearity of the test-object and the potential of the shakers to obtain accurate data in the 100 to 2,000 Hz frequency range. Accurate transfer function data as below allows correlating measured data to an FE model. Or when performing parameter extraction for modal analysis the stability prevents obtaining incorrect complex modes and allows a high degree of certainty and less operator dependence.
The bicycle frame has a very low damping and low weight. And this is a potential concern with the Qlws measurement in the 100 to 270 Hz frequency range. The graph below shows the instrumented hammer to Qlws shaker comparison below the 270 Hz, below the core frequency range. And indeed for the 130 Hz mode a clearly increased damping is seen for Qlws measurement relative to the hammer measurement. The next mode for this test-object at 375 Hz did not show any difference, as expected.
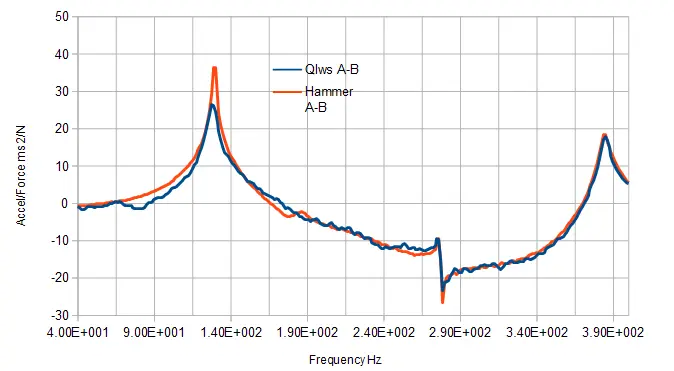
The lateral sway mode of the rear end of the frame occurs at 130 Hz. There is no significant shift in eigen-frequency in this case. Nonetheless it confirms that the frequency range below 270 Hz should be used with care on light objects. And it is always advised to locate excitation at structurally strong positions on test structures, not on protruding positions, nor towards the center of a panel of a thin or light weight test-object.
Large object example – Transfer path analysis
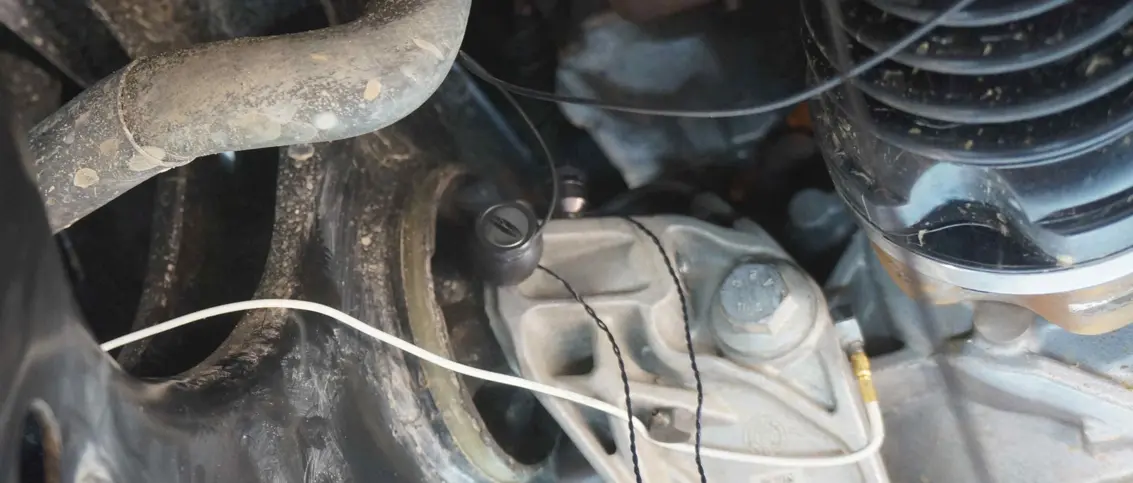
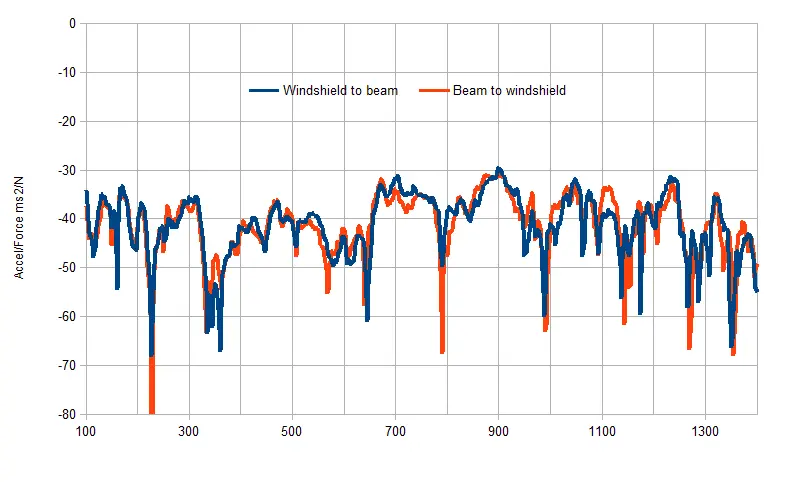
On a mid sized complete vehicle, transfer functions are measured between force on the main front beam (Figure 10) near the power-train support and the acceleration response on the windshield (Figure 9). The fully equipped trimmed body of this vehicle is around 700 kg in weight.
This application is more representative for transfer path, modification analysis and troubleshooting applications. Access to difficult locations is the most critical aspect for transfer path and load identification applications, and a higher uncertainty is accepted when the right location is excited. In case of modification analysis on a vehicle, like brackets or supporting structure variants or windshield variants, the requirement for reproducing data is high
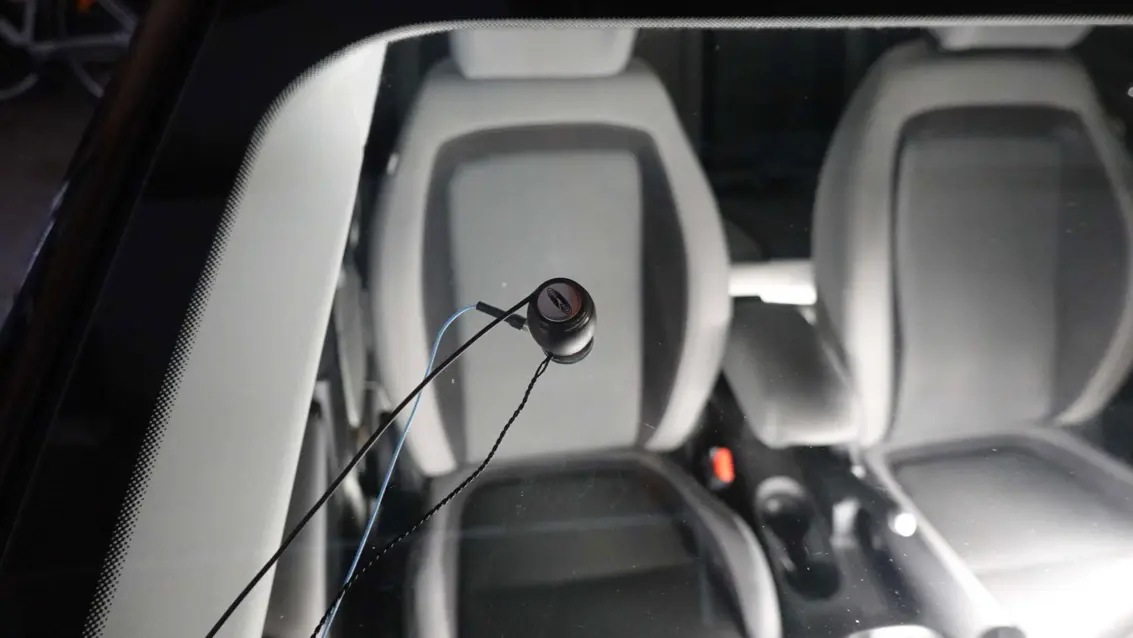
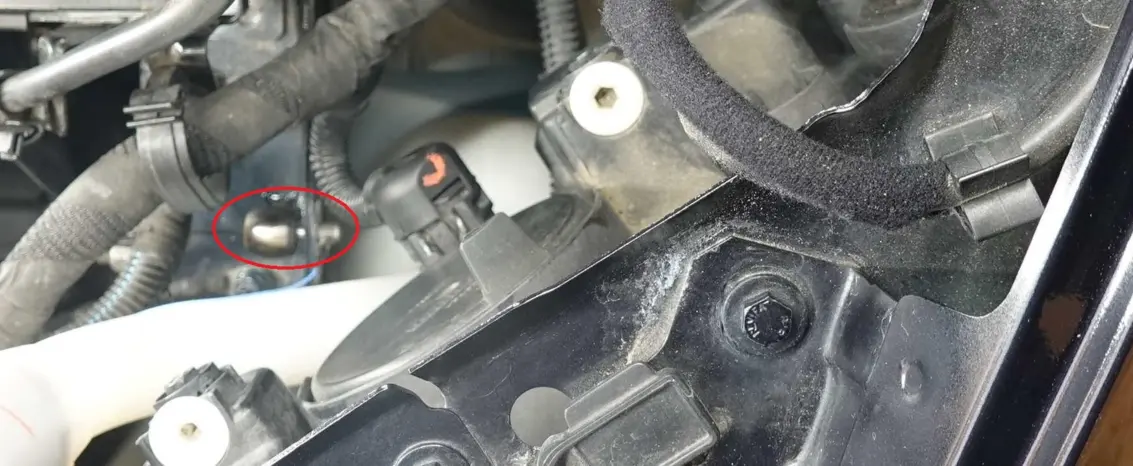
First the 100 to 2,000 Hz frequency range is excited with pink noise. Repeatability is first shown below.
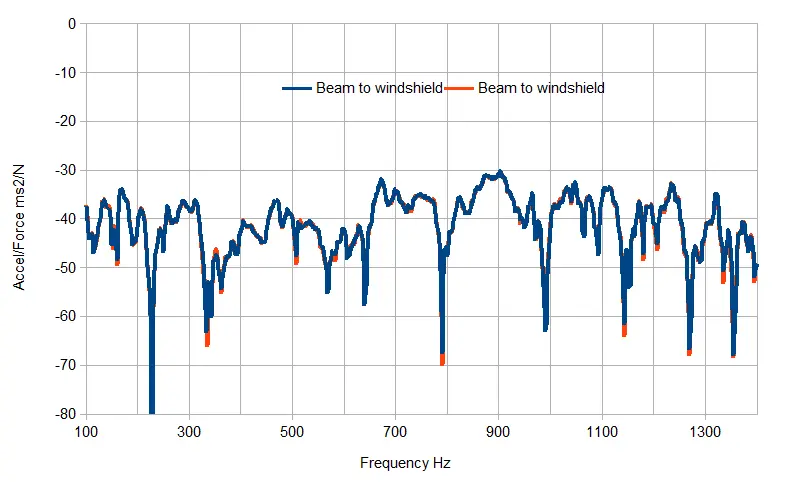
The transfer across the vehicle is low, so there is some more random error (noise) on the results. Nonetheless the shown FRF data stabilized within 60 seconds of data averaging. And apparently between 100 Hz and 2,000 Hz a good reciprocity is obtained. As shown in the reciprocal curves below.
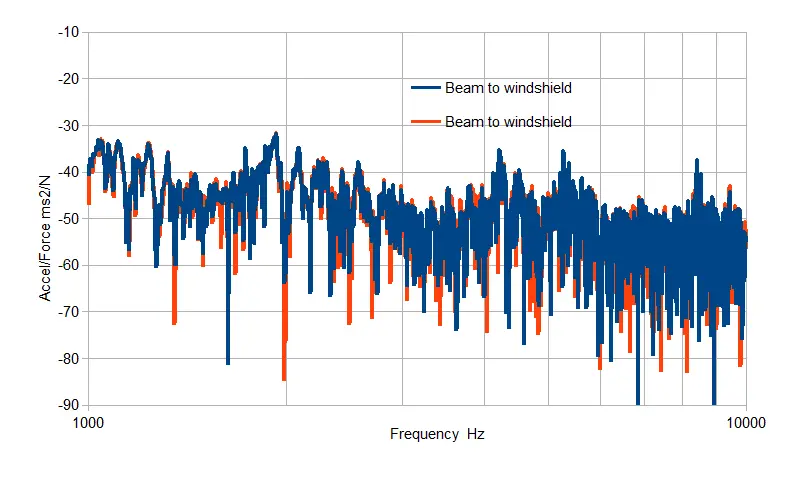
Next the 1,000 to 10,000 Hz range is covered using white noise for the same measurement locations on the vehicle. The transfer across the vehicle is low, especially above 6,000 Hz in this example. So, there is again some more random error (noise) expected on the results. Nonetheless the FRF data were reasonably stable within 15 seconds of data averaging. As can be seen on the graph below, the repeatability at all maxima in the responses was good despite the limited excitation force level from the Qlws shaker.
The reciprocity, in the graph below, shows that non-linearity effects are still limited on this complete vehicle for this frequency range below 6,000 Hz. Above 6,000 Hz the reciprocity is uncertain, mainly the acceleration response at the beam under excitation at the windshield was very low. Still, excitation alignment and response alignment were well under control. The maxima stabilized sufficiently and show decent reciprocity for a full vehicle. On such a heavy structure, the coupling effects of the Qlws, both to the windshield and to the beam, were not a significant effect.
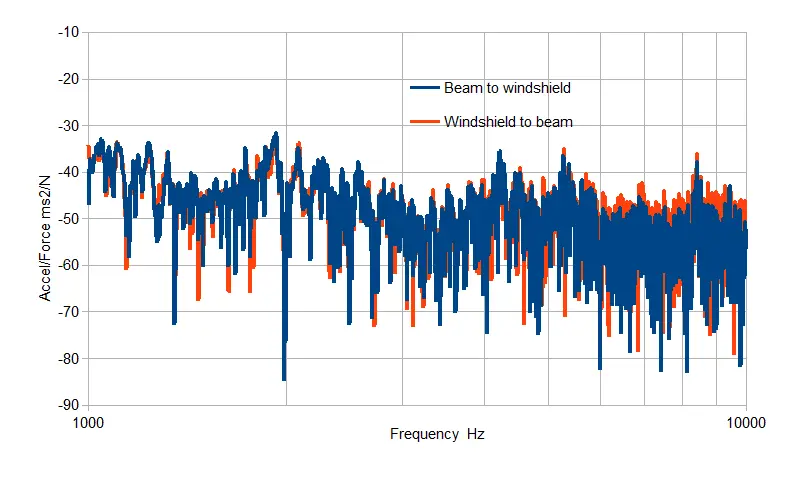
The repeatability and reciprocity obtained indicate that in the 270 to 10,000 Hz frequency range even high accuracy applications like mixed test-FE hybrid modelling and simulation model correlation is possible based on data from the self-suspending shaker measurements.
Resume
At Qsources we have worked on making shaker excitation feasible, more efficient, more accurate, in all locations and inclinations, including difficult access applications. The very small size, integrated force sensing, and patented decoupling system of the Qsources Qlws opens up a potential of increased efficiency and new applications and techniques.
Any measurement has a risk of containing inaccuracies, and all possible means of excitation have limits, so the awareness of potential deviations is valuable. High accuracy results from Qsources Qlws are certainly possible on test-objects between 0.5 and 500 kg in the 270 - 10,000 Hz core frequency range, and in some cases on lighter and heavier objects too. The extended frequency range 100 - 13,000 Hz is possible too, either with a lower accuracy, or on a limited group of heavier objects.
The stable continuous excitation by Qsources Qlws, without alignment concerns, is a mayor advantage in scanning measurements with a high density of measurement points. It is significantly more time efficient than other methods of excitation, leading to higher spatial resolution showing more local detail.


