Sound at higher frequencies that is inaudible to the human ear is commonly referred to as “ultrasound.” This typically covers the acoustic spectrum from 20 kHz to about 1 GHz. Frequencies beyond this range are referred to as hypersound.
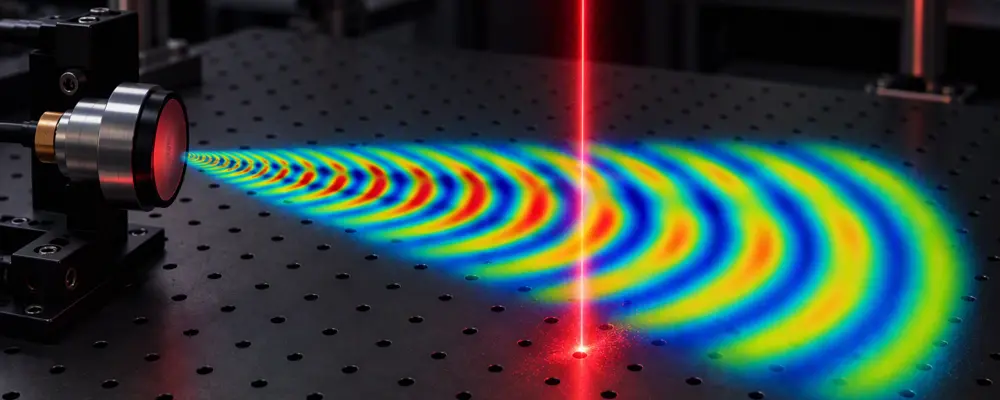
Nevertheless, ultrasound can be made visible to the human eye with the aid of optical measurement technology. Specifically, laser Doppler vibrometers (LDV) from Polytec can be used to make ultrasound visible.
To understand the mechanism behind this “audio-visual transduction,” it is necessary to understand how an LDV works. It is a so-called heterodyne laser interferometer, which is illustrated in Fig. 1 using a helium-neon laser source (wavelength 633 nm, red) as an example.
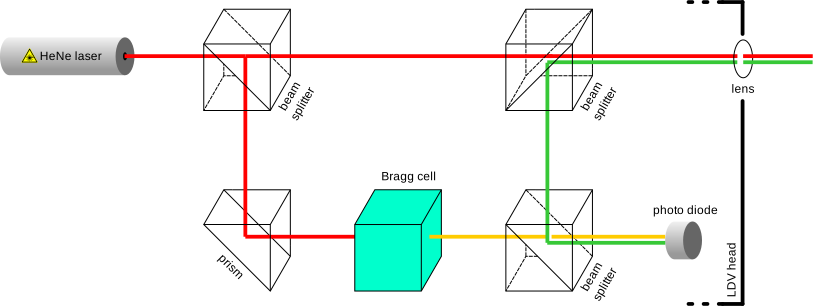
A laser beam is split into a measurement beam and a reference beam using a beam splitter. As the reference beam passes through an acousto-optic modulator (AOM, also known as a Bragg cell), its frequency is shifted upward by a precisely defined amount.
The frequency shift is only about 40 MHz and is therefore minimal given the fundamental frequency of the laser (e.g., 474 THz for red helium-neon-lasers). Nevertheless, for better visualization, the reference beam is shown in yellow in the figure.
The measurement beam, on the other hand, exits the LDV sensor head through a lens, and the signal reflected by the measurement sample (green) is captured again and directed, together with the reference beam, onto a photodiode via two additional beam splitters acting as mirrors. The resulting interference pattern of two waves with only minimally different frequencies generates a beat with a slowly oscillating amplitude. The photodiode can resolve this signal—which is perceptible as a fluctuation in brightness—relatively easily. In the static case, with the measurement sample at rest, the measured frequency then corresponds exactly to half of the frequency difference introduced by the Bragg cell (20 MHz).
In the standard mode of operation of the vibrometer (see Fig. 2), the measurement beam is reflected off a moving object and thus undergoes a frequency shift due to the optical Doppler effect—the faster the reflector moves toward the lens, the higher the frequency of the reflected beam. This reduces the frequency difference relative to the reference beam, and the brightness fluctuation at the photodiode slows down. Conversely, a reflector moving away from the lens causes a faster change in brightness. Finally, in the case of an oscillating reflector, its frequency manifests as a continuous alternation between a beat frequency that continuously increases and decreases. From this, one can infer the amplitude of the mechanical oscillation or the reflector’s vibration.
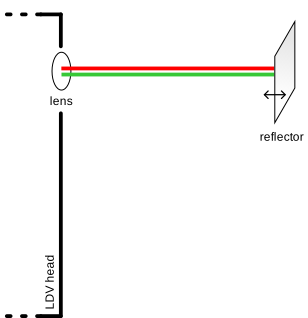
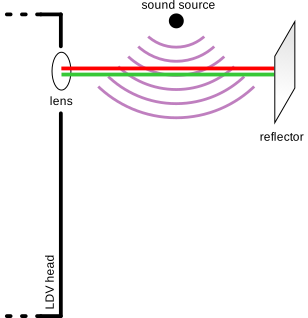
Fig. 2 | Laser Doppler vibrometer: Conventional mode (left) and refracto-vibrometry (right)
In the vibrometer’s operating mode used for ultrasound visualization, however, the reflector remains stationary. Nevertheless, a continuous sound wave travels through the air-filled space between the lens and the reflector. The speed of light is generally density-dependent. Because sound is a periodic density fluctuation, the time that the measurement beam requires to traverse the geometrically fixed distance between the lens and the reflector depends on the sound pressure within this space. Since both the measurement beam and the reference beam share the same time base (i.e., they are coherent with each other), the change in transit time causes a periodic phase shift, which mathematically has the same effect on the beat signal as in the conventional operating mode. This is why it is also referred to as a “virtual Doppler effect,” since the LDV detects an apparent vibration even though the reflector remains stationary.
Due to the relationship between density and refractive index, as well as the apparent vibration of the reflector caused by the sound propagating over it, this mode of operation of the interferometer is referred to as “refracto-vibrometry.” If a scanning LDV is used, it is ultimately possible to visualize entire sound fields.
This measurement technique was used in the laboratories at OTH Regensburg to measure the radiation patterns of capacitive ultrasonic transducers (CMUTs). A Polytec scanning vibrometer was used for this purpose.
CMUTs, as micromechanical components, have been the subject of research for many years, particularly for medical applications in ultrasound imaging. In addition, they are increasingly finding their way into other diagnostic and therapeutic as well as non-medical applications. OTH Regensburg focuses primarily on their use in the field of airborne ultrasound, for example as a sensor element for a flow meter.
Due to their inherently low susceptibility to structure-borne sound-induced crosstalk, CMUTs are particularly well-suited for the dense integration of multiple elements onto a single microchip. Such an array structure consisting of independently addressable transmitters thus enables so-called acoustic beamforming—that is, the electronically controlled manipulation of the sound’s radiation direction. Numerous applications thus benefit significantly from increased sensitivity of CMUTs or become feasible in the first place.
To verify the performance, it is necessary to record a high-resolution representation of the sound field of a CMUT at various beamforming angles. To this end, several transducers with frequencies ranging from 200 to 400 kHz were evaluated with respect to their radiation characteristics. Using refracto-vibrometry, complete sound fields could be scanned much more quickly than with a mechanically movable microphone probe. In particular, the intensity ratio of the main lobe to the side lobes is an important metric for beamforming quality.
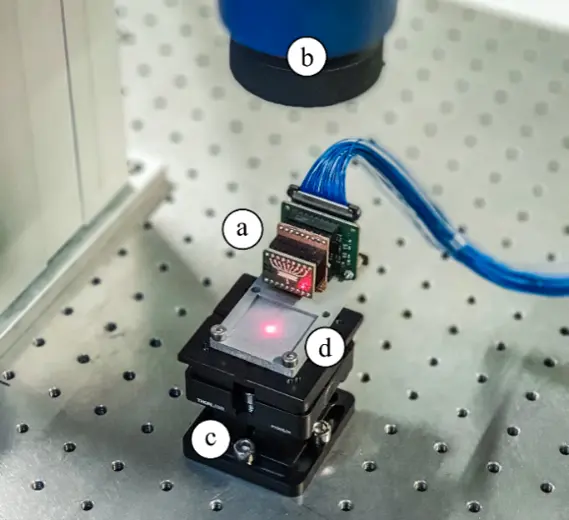
For this purpose, an CMUT (a) with a center frequency of 266 kHz (corresponding to a wavelength in air under standard conditions of 1.29 mm) was fixed, as shown in Fig. 3, beneath an LDV measuring head (b) on an adjustment device (c) with a stationary reflector (d).
After the CMUT is excited, the measurement beam—focused on a single point—passes through the sound field twice. The sound-induced local pressure fluctuation alters the transit time of the laser beam only minimally. However, this is sufficient to detect an interferometric change in the measurement head. Once the measurement is set up, the Polytec Scanning Vibrometer records the two-dimensional sound field fully automatically.
A representative selection of the results is shown in Fig. 4. Each sound field represents a kind of “snapshot” of the pressure distribution at a specific point in time.
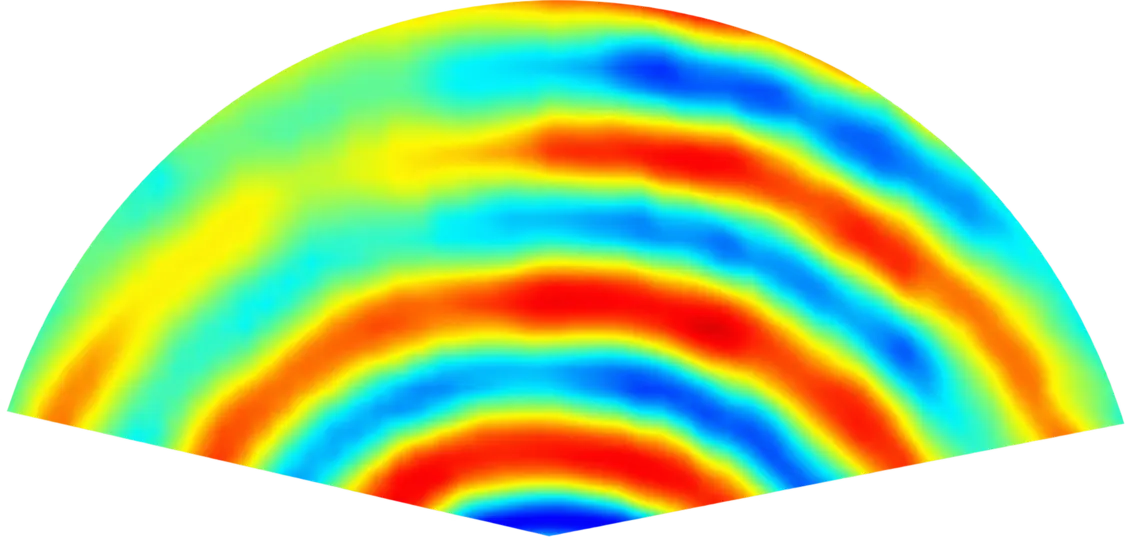
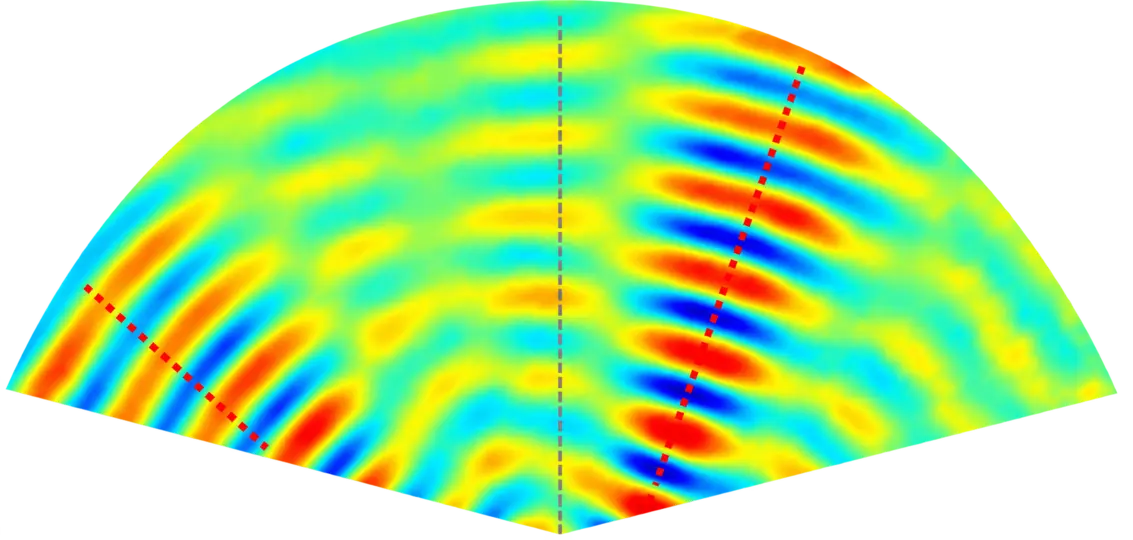
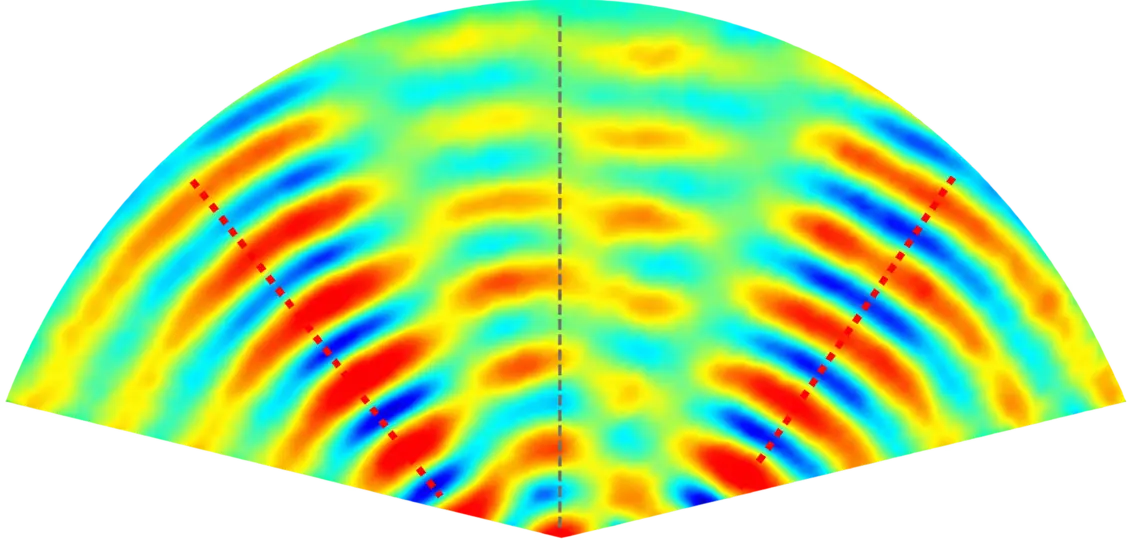
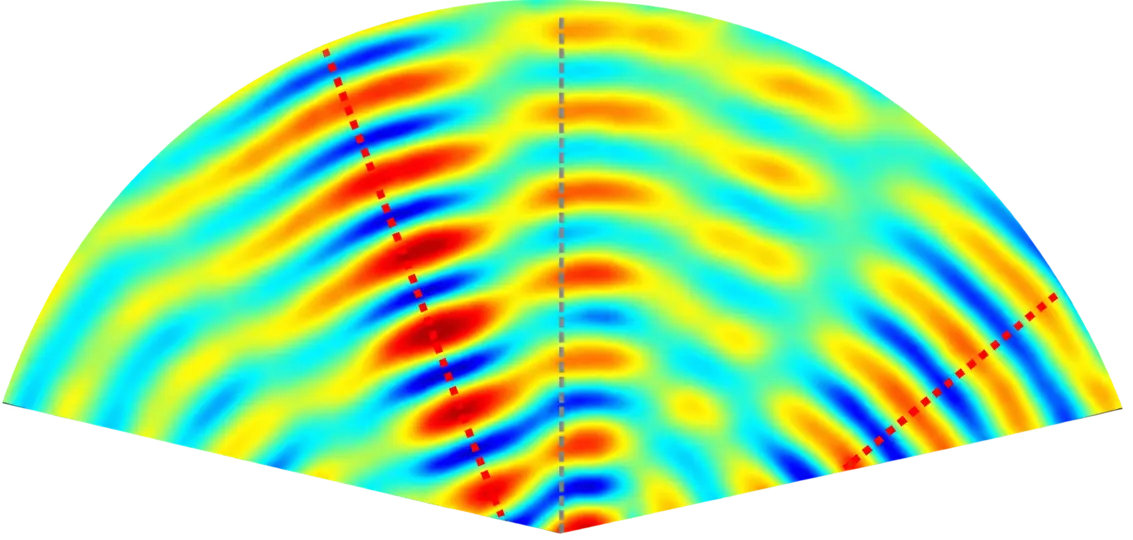
In the first recording (a), a single CMUT element was excited. Because its size is smaller than the wavelength of the sound, the typical radiation pattern of a point source is observed. In contrast, the recordings (b)–(d) show the operation of the complete ultrasonic transducer array with various targeted beam steering angles. The respective main lobes in the desired directions, as well as the associated grating and side lobes, can be clearly identified.
In conclusion, refracto-vibrometry represents a highly precise and, above all, rapid method for characterizing ultrasonic transducers, particularly for small sound fields (< 5 x 5 cm²) and for wavelengths greater than the spot size of the laser at the focus. Looking ahead, this also makes the introduction of automated acoustic testing for mass production of ultrasonic transducers a viable prospect.