The measurement of frequency response function (FRF) plays an important role for the dynamic characterization of structures. In most cases, the goal is the measurement-based analysis of a system or the determination of the dynamic properties for validating a simulation model.
A widely used method in structural dynamics to acquire FRF is to use an impulse hammer for system excitation and accelerometers for response measurement. A disadvantage of this method is the change of the system under analysis due to the mass and stiffness (cables) of the applied sensors, which, for example in very light structures, can cause a significant change in the structural dynamic behavior.
One alternative for the non-contact acquisition of the system responses and of eliminating mass loading effect of a contact sensor, is the use of laser Doppler vibrometers (LDVs). Compared to accelerometers, previous laser vibrometer measurement systems had the disadvantage that, for example in the area of vibration nodes or for crosstalk components (response degree of freedom perpendicular to the excitation direction), the signal-to-noise ratio wasn’t “clean” enough. This limited its ability to be used for applications such as frequency-based substructuring (FBS), until now.
The following article deals with the application of QTec multi-path interferometry for the acquisition of FRF of technical structures. Comparisons with accelerometers as well as to single-path interferometer (PSV-400) for two different application cases are presented.
Example 1: Input admittance measurement on a vehicle
An important task for the structural dynamic evaluation of a system is the detection of admittances (velocity/force) at coupling points to other components. An analysis of the mechanical admittance at the interfaces enables, for example, the evaluation and identification of frequency ranges in which text fixture may influence the behavior of the structure under test. This plays an important role in particular in the design and characterization of "blocked force" test rigs.
In general, a complete evaluation of the interfaces requires the consideration of all three translational and rotational degrees of freedom. In other words, crosstalk components components (perpendicular to the excitation) are as important as the main degrees of freedom (in the direction of excitation) and must be recorded in most test cases. Input admittance measurements to evaluate the suitability of QTec multi-path interferometry were performed on a vehicle side member close to the excitation position. The measurement location as well as the positioning of the scan heads are shown in figure 1.
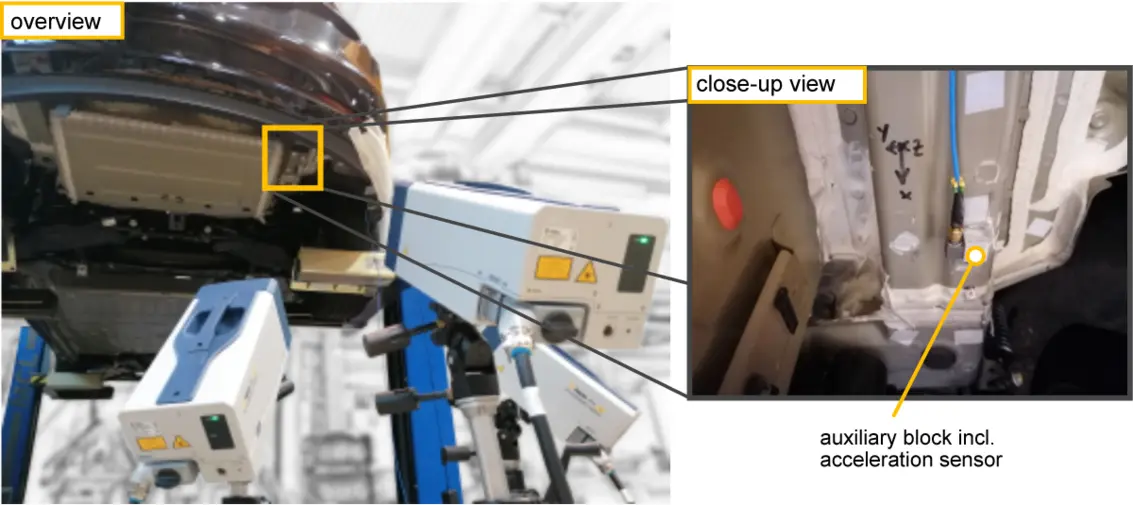
The right part of Figure 1 shows a detailed view of the measuring point. To be able to excite all three translational degrees of freedom, an auxiliary block made of aluminum was glued to the location, on which an accelerometer (manufacturer PCB Piezotronics, model 365A45) was applied for comparison with the vibrometer data. Additionally, retroreflective tape was applied to the block to guarantee optimal signal quality of optical measurement. Further tests showed that very good results could be obtained even without the tape. The structure was excited using an impact hammer (manufacturer PCB Piezotronics, model 086C03) with different hammer tips.
In addition to the PSV QTec, a "PAK MKII" system (Müller-BBM VibroAkustik Systeme GmbH) was used for data acquisition in order to evaluate the individual hammer impacts separately. The force signal was also sent to the PSV QTec in addition to the accelerometer (X/Y/Z) outputs so that FRF measurements from both sensors (accelerometer & vibrometer) can be compared seamlessly. To ensure “apples-to-apples” comparison, the same window settings (rectangular window for force signal; exponential window for response signal/s) were used for both systems. Figure 2 shows the comparison of admittance with different excitation orientations.
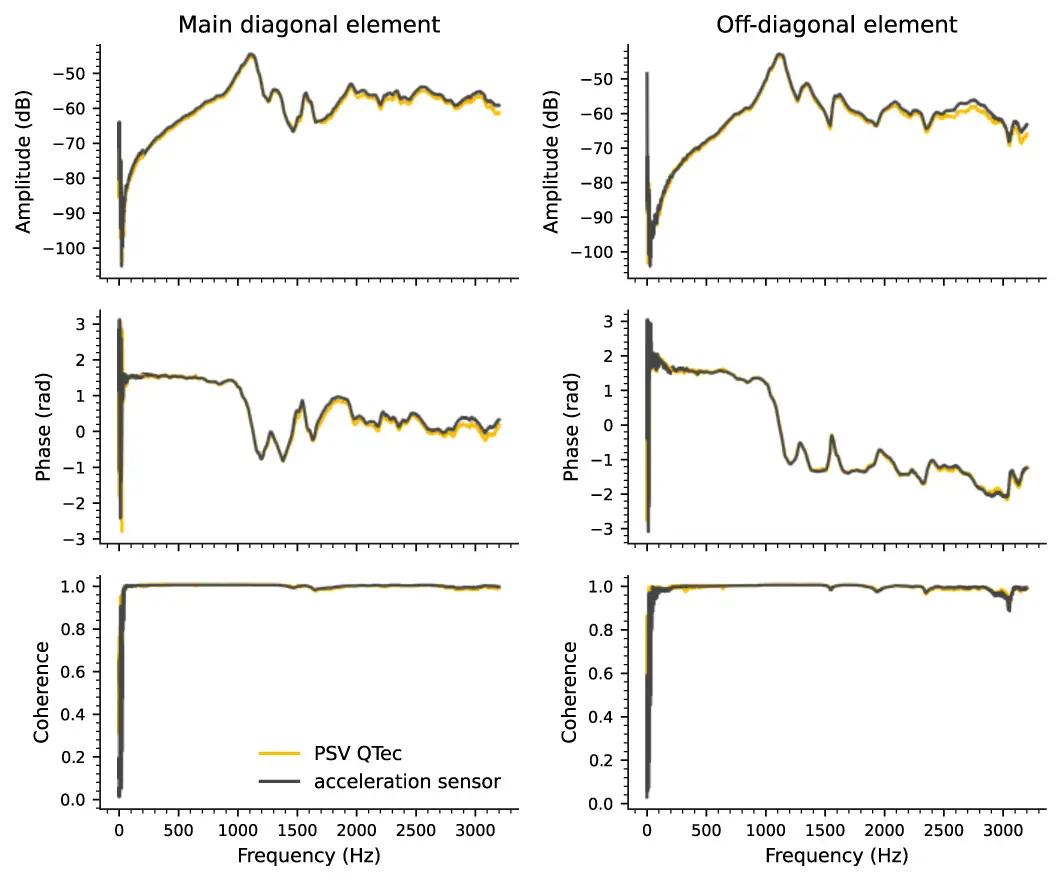
The left part of Figure 2 shows the element of the main diagonal where both excitation and response detection occurs in the y-direction (transverse to the longitudinal axis of the vehicle). In contrast, the three plots on the right include the admittance with excitation in the z-direction (vertical axis of the vehicle) and response detection in the y-direction. The FRFs shown were combined from two measurements made using two hammer tips of different hardness to cover as wide a frequency range as possible (soft tip up to approximately 200 Hz; hard tip from 200 to 3000 Hz).
As shown in the figures, the selected admittances match very well in both amplitude and phase frequency response. The presented case-study illustrates that both methods of response acquisition lead to comparable results for both main and crosstalk components. This proves that multi-path interferometry for the acquisition of input admittances of real technical structures is possible for possible for main and off-diagonal elements.
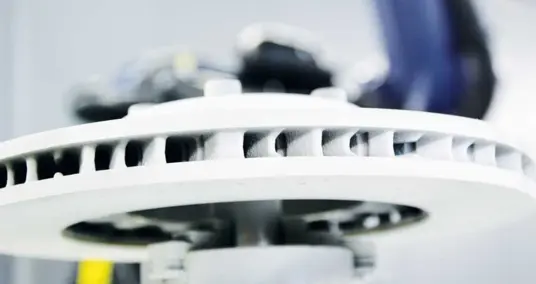
Example 2: Experimental modal analysis on a plastic component
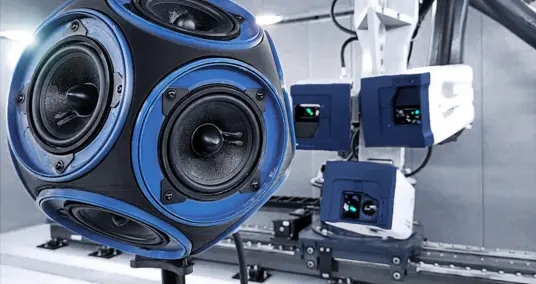
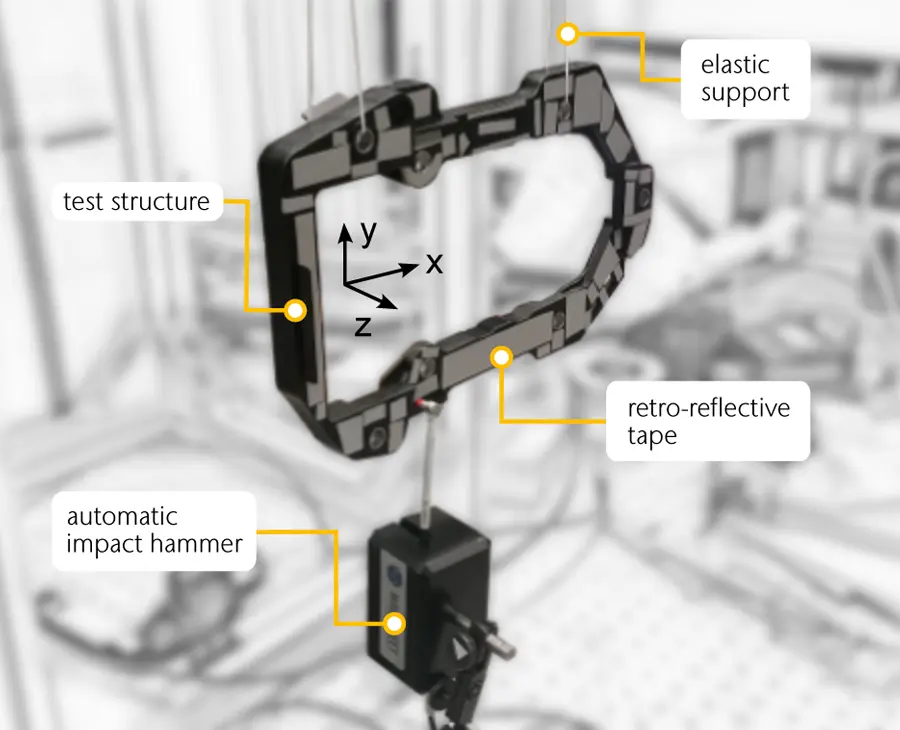
The second example presented here is intended to compare the two vibrometer measurement systems PSV QTec (multi-path) and PSV-400 (single-path). For this purpose, an experimental modal analysis (EMA) was performed on a plastic component using both systems. The experimental setup is shown in Figure 3. In addition to the coordinate system, the figure contains the free-free suspension of the system, the positioning of the automatic modal hammer (manufacturer Maul-Theet GmbH, model vImpact-60) and the preparation of the measured object with retroreflective tape.
Both experiments were conducted using identical scan-point grid (approx.. 120 measurement locations), measurement settings and comparable excitation source. First, the comparison of the acquired FRF is made using the real parts of the determined admittances as an example, which is shown in Figure 4. The left and the right parts show the FRF from PSV QTec and PSV-400 respectively. The two upper diagrams contain the responses in the y (inplane) direction. The lower plots show the system responses in the z (out-of-plane) . The diagrams are used for qualitative comparison of the real parts, which is why the individual responses are shown slightly transparent. Darker areas therefore indicate frequencies at which several FRF overlap.
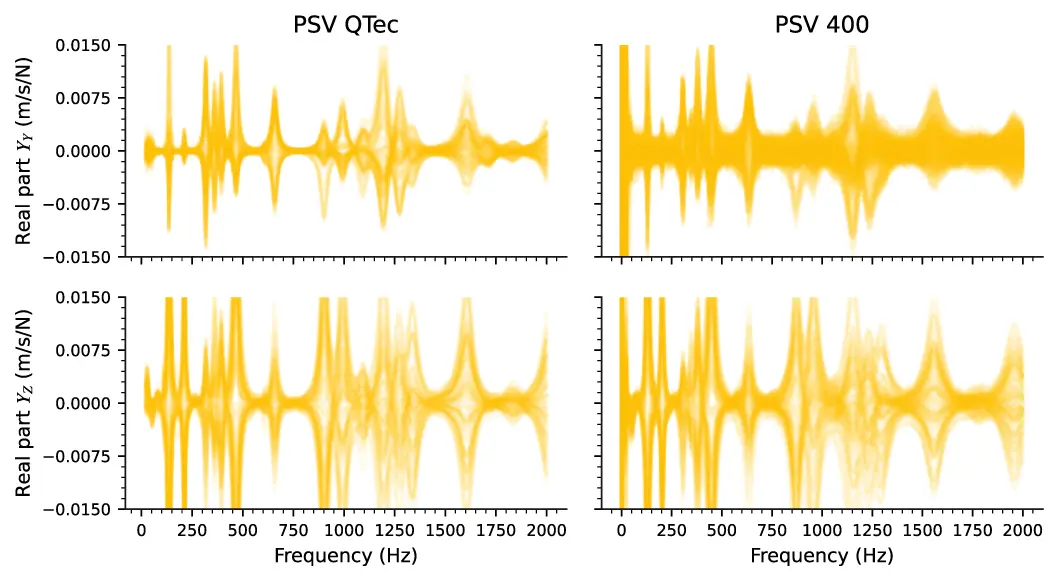
First, the comparison of FRFs in z-direction shows good qualitative agreement between the two measurement systems. The discernible shifts in the resonances, for example at approx. 2 kHz, can be explained by the preconditioning of the plastic component. The measurement with the PSV-400 was carried out after conditioning the sample in an environmental chamber. The measurement using the PSV QTec, on the other hand, was performed without preconditioning, which can lead to a shift in natural frequencies due to the change of moisture content in the material.
Compared to the out-of-plane (z) data, significant differences can be observed in the inplane (y) FRFs – shown in the top two plots. This is especially true for the noise floor, which is much more pronounced and several times higher for the PSV-400 compared to the QTec system. The pronounced noise floor, especially in regions with high modal density (750-1500 Hz in this case) and dominant inplane components can make it difficult or impossible to determine modal parameters with acceptable confidence. Finally, a comparison of modal damping estimation using the two systems is shown in Figure 5.
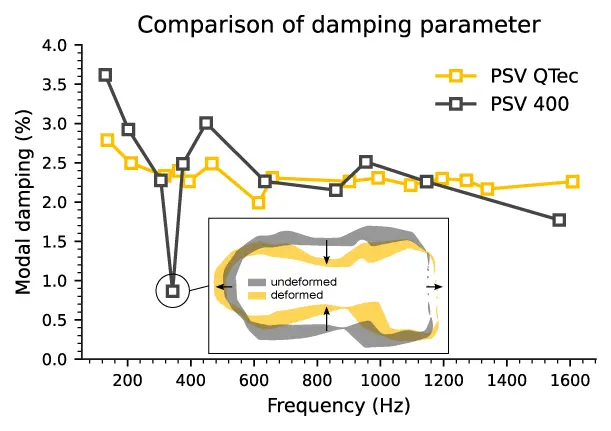
Based on the points shown in the figure, it can be observed that significantly more modes can be determined using the PSV QTec, which is especially true in the frequency range 750 – 1500 Hz. The figure also includes a representation of the fourth mode, which shows a dominant inplane component and for which clearly different damping values were determined. This is due to the higher noise floor of the PSV-400 (single-path interferometer) in the inplane direction. In summary, the comparison shows that significant advantages can be obtained with multi-path interferometry when performing an EMA.
Conclusion and outlook
The presented comparisons show that QTec multi-path interferometry allows the use of optical laser vibrometer measurement systems for the acquisition of FRF with unparalleled dynamic range – very low to very high displacements. Furthermore, the improvements compared to single-path interferometry, especially in the inplane and crosstalk measurements opens up possibilities for an entirely new spectrum of applications.
For example, frequency-based substructuring (FBS) mentioned earlier, would be a perfect candidate to take advantage of this innovative technology. An important component of FBS is the characterization of coupling points, which can be detected in greater spatial detail with optical methods compared to accelerometers and considered in the subsequent numerical methods. This enables an extension of existing experimental analysis methods, especially in frequency ranges where coupling points exhibit elastic deformations.